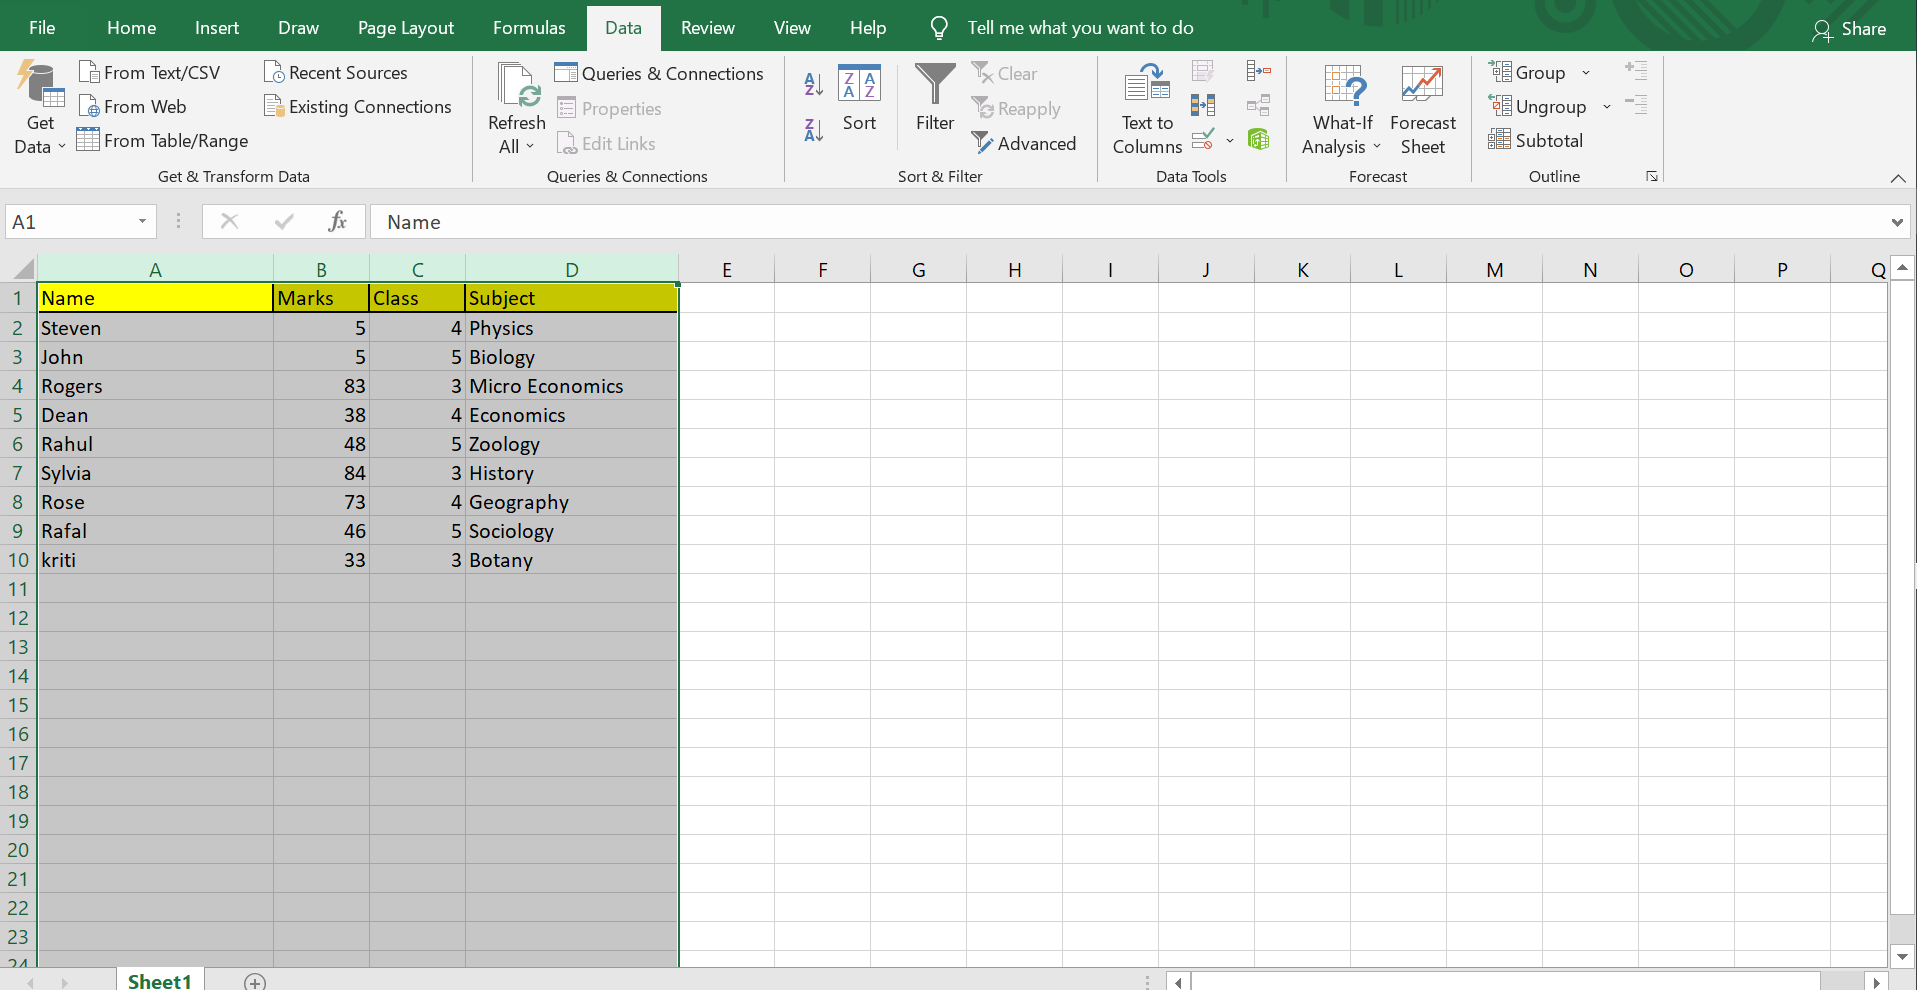
10 Tips to Make Your Excel Sheets Visually Appealing

Excel spreadsheets are often associated with rows upon rows of numbers, data, and somewhat complex analysis. However, they don't have to be bland or monotonous. Making your Excel sheets visually appealing not only makes the data easier to interpret but also enhances user engagement and productivity. Here are ten tips to elevate the visual appeal of your Excel sheets:
1. Use Color Coding Effectively


Color coding is a straightforward yet powerful way to make your spreadsheet visually appealing and easier to navigate:
- Purposeful Use: Assign specific colors to different categories or types of data. For instance, use green for financial gains, red for losses, and blue for informational content.
- Consistency: Ensure that the color coding is consistent throughout your spreadsheet to avoid confusion.
- Accessibility: Be mindful of color blindness and contrast issues. Use patterns or labels alongside colors for clarity.
2. Employ Smart Formatting

Formatting isn’t just about aesthetics; it’s about clarity and efficiency:
- Use bold or italic text for important cells or to highlight titles.
- Apply conditional formatting to automatically highlight data points based on set criteria, making anomalies or key data easily noticeable.
3. Implement Charts and Graphs


Visual representation through charts and graphs can convey complex data with clarity:
- Choose the right type of chart for your data. Line charts for trends over time, pie charts for proportions, etc.
- Ensure that your charts are labeled correctly with titles, axis labels, and legends.
- Use colors in your charts that align with your color coding system for easy reference.
4. Keep It Simple and Clean

The mantra “less is more” applies to Excel sheets as well:
- Avoid clutter by removing unnecessary gridlines, borders, or excessive shading.
- Utilize white space effectively to give your data room to breathe.
- Maintain a straightforward structure; complex layouts can overwhelm users.
5. Add Visual Accents

Subtle visual enhancements can add flair to your spreadsheets:
- Use icons or symbols to represent data points or trends. For example, arrows for growth or decline, stars for ratings, etc.
- Subtly align text or images within cells to create visual harmony.
6. Customize Headers and Titles

Headers and titles set the tone for your spreadsheet:
- Use larger, bold fonts for headings to make them stand out.
- Consider using different font styles for titles to differentiate them from regular text.
- Adjust cell padding for headers to provide additional visual separation.
7. Organize with Grouping

Grouping cells can create a cleaner look:
- Use the group feature to collapse or expand sections, making navigation through data easier.
- Combine related data under headings or within borders for improved readability.
8. Play with Font Sizes and Styles

Fonts can significantly impact the visual appeal:
- Experiment with different fonts, but keep it professional. Sans-serif fonts like Arial or Calibri are usually preferred in business settings.
- Change font size for different levels of information, with larger sizes for primary information and smaller for details.
9. Utilize Sparklines

Sparklines offer a micro-charting solution for in-cell data visualization:
- Integrate sparklines within cells to give a quick visual summary alongside data.
- Choose the sparkline type that best represents the data trend or comparison.
10. Prioritize Readability

The ultimate goal is to make your data understandable:
- Ensure text is legible by using adequate contrast between text and background colors.
- Implement a hierarchical structure for information to guide the user through the data.
- Limit the number of fonts used to maintain a professional appearance.
💡 Note: Avoid overuse of formatting; too many styles can make your spreadsheet harder to read and interpret.
To conclude, by applying these tips, your Excel sheets can transform from ordinary data collections into compelling, visually engaging tools that not only convey information more effectively but also enhance user interaction. Whether for business presentations, personal budget tracking, or complex data analysis, a visually appealing spreadsheet can make all the difference in data comprehension and user engagement.
How can I ensure that my color coding is accessible for everyone?

+
Using patterns alongside colors, ensuring high contrast, and providing labels or keys can help make your spreadsheets accessible to those with color vision deficiencies.
What are some resources for learning more advanced Excel formatting?

+
Excel offers built-in tutorials, and there are numerous online courses, blogs, and forums where you can find advanced formatting tips and tricks.
Can these tips be applied to other spreadsheet programs?

+
Yes, many of these tips are universal and can be applied to Google Sheets, Apple Numbers, and other spreadsheet software with minor adjustments for platform-specific features.


