Effortlessly Insert Tables in Excel: Beginner's Guide

How to Insert Tables in Excel: A Step-by-Step Beginner's Guide

Mastering the art of inserting tables into your spreadsheets is a crucial skill for any Excel user. Not only does it make your data look more organized, but it also allows for easier data analysis and manipulation. In this detailed guide, we will walk you through the steps to insert tables in Excel, tailored for beginners to ensure you can start enhancing your spreadsheets right away.
Understanding the Benefits of Using Tables in Excel

Before we dive into the how-to, let's explore why you should bother with tables:
- Enhanced Readability: Tables automatically format your data with alternating row colors, making it visually more appealing and easier to scan through.
- Quick Data Management: When you convert data into a table, you gain access to features like sorting, filtering, and totals without extensive configuration.
- Automatic Expansion: As you add more rows or columns, the table automatically expands to accommodate your data.
- Improved Formulas: Tables have structured references, which simplify formula creation and maintenance.
Step-by-Step Guide to Insert Tables in Excel

Step 1: Select Your Data Range
The first step is to highlight the data you want to convert into a table:
- Click and drag to select the cells you wish to include.
- For best results, ensure your data has headers which will become the table's column headers.
🚨 Note: Ensure your headers are distinct from the data to avoid confusion.
Step 2: Convert to Table
With your data selected:
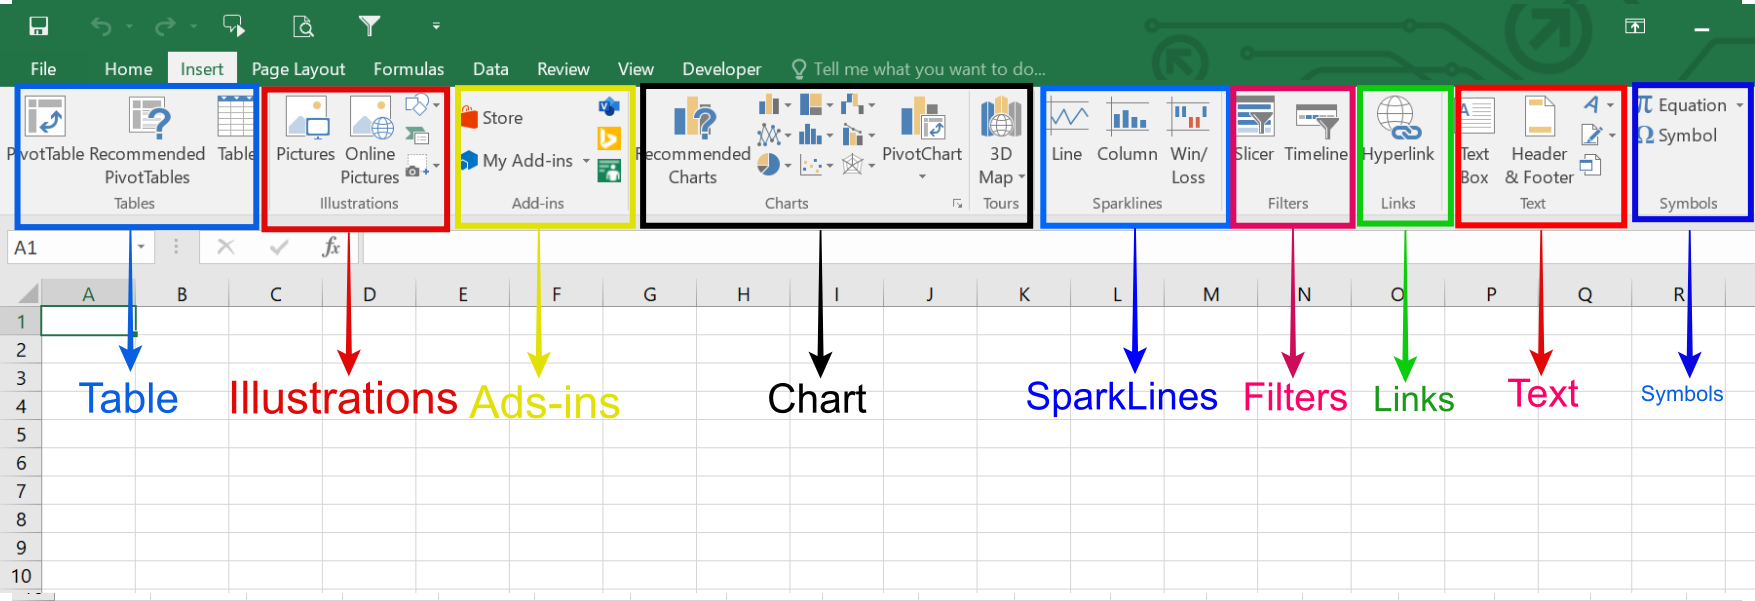
- Go to the ‘Insert’ tab on the Ribbon.
- Click on ‘Table’ or use the keyboard shortcut Ctrl+T.
A dialogue box will appear, asking if your table has headers. Confirm this and click ‘OK’.
Step 3: Customize Your Table
Now that your data is in a table format:
- Name Your Table: Use the ‘Table Name’ box under the ‘Table Tools Design’ tab to give your table a unique name for easy reference in formulas.
- Change Table Style: Select from a variety of table styles to match your presentation or company branding.
- Add Totals Row: Turn on the ‘Total Row’ feature for quick summaries of your data columns.
🧑💻 Note: Your tables will inherit the design theme of your workbook, but you can manually customize this.
| Feature | Functionality |
|---|---|
| Name | Allows for unique naming of tables for formula referencing |
| Style | Customize table appearance |
| Total Row | Provides instant summary statistics |

Advanced Table Management

Once you've created your table, you might want to explore more advanced features:
- Sort and Filter: Click on the arrow in the header cell to sort or filter your data.
- Calculated Columns: When you enter a formula in one cell of a column, Excel will automatically fill the rest of the column with the same formula.
- Slicers: For interactive data filtering, insert a slicer to make your table more user-friendly.
Wrapping Up

By following this guide, you've learned how to transform raw data into an organized, dynamic table in Excel. Remember, tables in Excel not only make your data look better but also equip you with tools for quick analysis, updates, and data management. From basic table creation to advanced customization, your journey with Excel tables has just begun.
Can I convert a table back into a regular range?

+
Yes, by selecting any cell in the table, then going to the ‘Table Tools Design’ tab and clicking ‘Convert to Range’.
What if I want to add data to my table?

+
When you type data adjacent to an existing table, Excel will automatically expand the table to include this new data.
How do I remove table formatting without deleting my data?

+
Select the table, go to ‘Table Tools Design’, and choose ‘Clear’ to remove only the table formatting.
What are Slicers used for in Excel?

+
Slicers are visual tools for filtering table data, making it easier to manage and analyze large datasets interactively.


