Master Excel Coloring Techniques Easily

Excel is not just a tool for crunching numbers and managing data; it's also a powerful platform for visually enhancing your spreadsheets to make them more understandable and visually appealing. In this guide, we will delve into the different Excel coloring techniques that can transform your spreadsheets into vibrant and effective data presentations.
The Basics of Excel Cell Formatting

Before we dive into the more advanced coloring techniques, let’s start with the basics of cell formatting in Excel. Here’s how you can begin to enhance your spreadsheet:
- Selecting Cells: Click and drag to highlight the cells you want to format.
- Accessing Format Options: Right-click or go to the 'Home' tab, where you'll find various formatting tools.
👉 Note: Remember, the 'Home' tab is your primary control panel for all cell formatting in Excel.
Setting a Cell Background Color

One of the simplest yet most effective ways to make your data pop is by setting a cell’s background color:
- Select the cells you wish to color.
- Click the 'Fill Color' button (the paint bucket icon) in the 'Home' tab.
- Choose a color from the palette that appears or select 'More Colors' for custom options.
This basic step can help in:
- Differentiating between different data sets or categories.
- Highlighting important information or headings.
Conditional Formatting for Dynamic Colorization

Excel's conditional formatting feature is where the real magic happens. Here's how to use it for dynamic colorization:
- Select the cells you want to apply conditional formatting to.
- Go to 'Home' > 'Conditional Formatting' > 'New Rule'.
- Choose the type of rule you want to apply (e.g., "Format cells that contain...").
- Set the conditions. For example, if you want cells to change color when a value exceeds 100, set the rule to "
> 100". - Click 'Format', choose the Fill tab, and select a color.
- Confirm by clicking 'OK' on each dialogue box.
Here are some ways conditional formatting can be applied:
- Highlight cells with negative numbers in red.
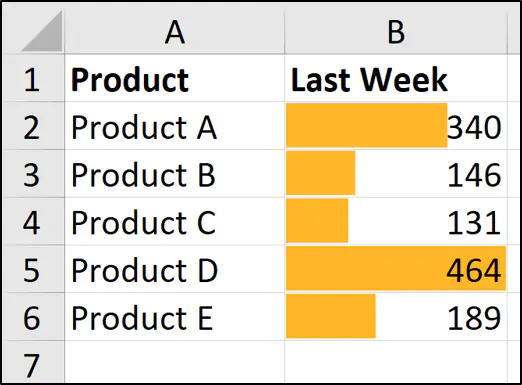
- Create data bars or color scales to visually represent data trends.
| Conditional Formatting Feature | Use Case |
|---|---|
| Highlight Cell Rules | Quickly highlight cells based on text, numbers, or dates. |
| Top/Bottom Rules | Mark top or bottom values, above or below average, etc. |
| Data Bars | Represent data visually in the cells with bars. |

🔖 Note: Use Conditional Formatting when you need to color cells based on cell contents, which changes dynamically as the data changes.
Using Color Scales for Data Representation

Color scales provide an intuitive way to visualize data distribution across your spreadsheet:
- Select the range of cells you want to apply a color scale to.
- Under 'Home' > 'Conditional Formatting' > 'Color Scales', choose a pre-set scale or customize one.
- Colors will be applied based on the cell values within the selected range.
Icon Sets for Quick Visual Identification

Excel offers icon sets which can be used to instantly visualize data thresholds or trends:
- Select the range of cells.
- Go to 'Home' > 'Conditional Formatting' > 'Icon Sets'.
- Choose from various icons like arrows, flags, or traffic lights.
Customizing Your Color Scheme

Creating a unique color scheme can make your spreadsheet stand out:
- Go to 'File' > 'Options' > 'General' > 'Colors'.
- Here you can add, modify, or delete color palettes.
- Ensure to select colors that are visually pleasing and work well with the data.
In this final part of our guide, we've explored how you can enhance your Excel spreadsheets with various coloring techniques. From simple background color changes to complex conditional formatting, each method serves to make data more accessible and understandable. Remember that while colors are visually appealing, they should also serve a functional purpose in highlighting, categorizing, or illustrating data relationships. By mastering these techniques, you'll not only improve the aesthetic appeal of your spreadsheets but also their functionality, making data analysis and presentations far more effective.
What is the easiest way to apply a background color in Excel?

+
The easiest way is to select the cells, click the ‘Fill Color’ button in the ‘Home’ tab, and choose your color from the palette provided.
Can Excel change cell color based on data?

+
Yes, through Conditional Formatting. You can set rules to change the cell color based on its content or values automatically.
How can I create a custom color palette in Excel?

+
Go to ‘File’ > ‘Options’ > ‘General’ > ‘Colors’. Here, you can add or modify colors to create a personalized palette.


