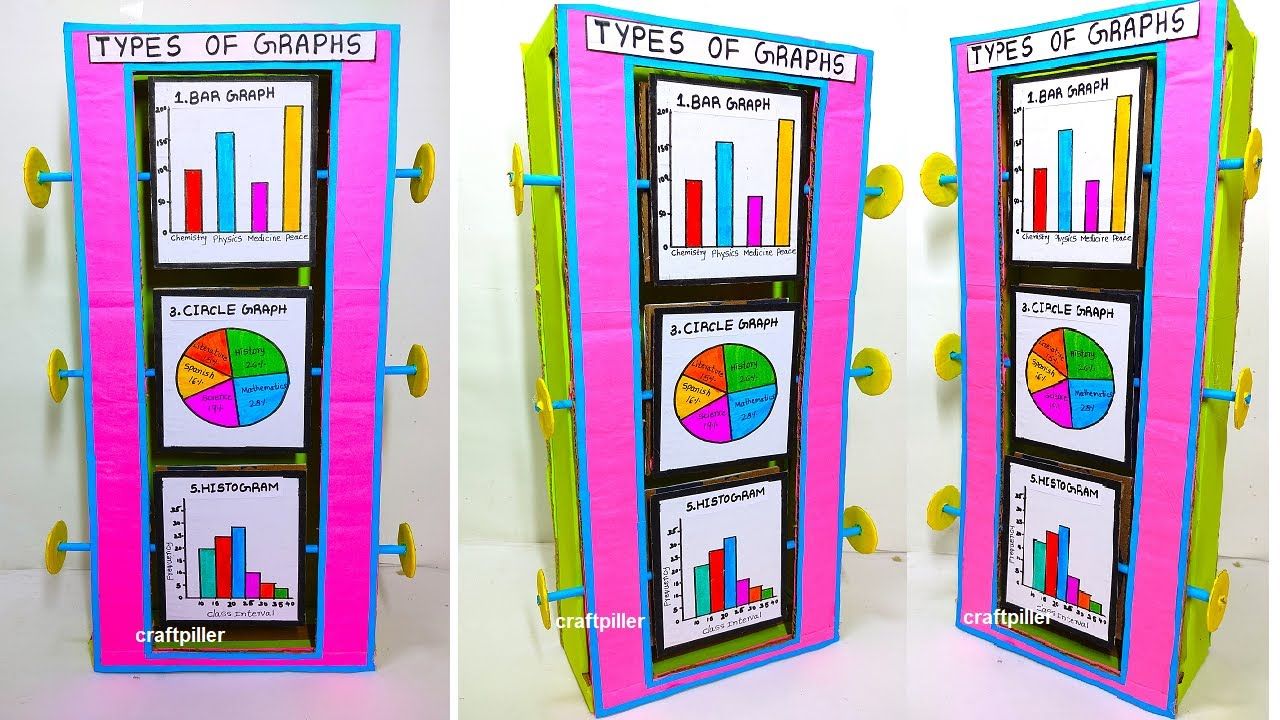
Draw Graphs from Excel Sheets: Quick Tips

Data visualization has become an essential tool for making sense of the vast amounts of data we generate and encounter daily. By converting complex datasets into visual formats like graphs and charts, we can grasp trends, patterns, and anomalies much quicker. This blog post delves into how you can efficiently create graphs directly from Excel sheets, offering you quick tips to enhance your data visualization skills.
Understanding Excel's Graphing Capabilities

Excel is renowned for its robust capabilities in data handling and visualization. Here's a brief overview of what you can do with Excel:
- Wide Range of Charts: From bar and line charts to pie, scatter, and bubble charts, Excel offers various graphical tools to represent your data.
- Customization: Excel allows for extensive customization of chart elements like colors, labels, and axes, tailoring your graph to your needs.
- Dynamic Updates: With linked data, changes in your Excel sheet automatically update your graphs, ensuring data consistency.
Quick Tips for Graphing in Excel

Here are some practical tips to streamline the process of creating graphs from Excel sheets:
1. Select the Right Data

Before plotting your data:
- Ensure Accuracy: Double-check your data for any errors or outliers that could skew your graph.
- Organize: Keep your data in a logical order, which will make selection easier and reduce clutter.
- Include Labels: Use headers or labels for your data columns to make your graph self-explanatory.
2. Choose the Appropriate Graph Type

Here's a quick guide:
| Data Type | Recommended Chart Type |
|---|---|
| Comparison of Categories | Column or Bar Chart |
| Trends Over Time | Line or Area Chart |
| Parts of a Whole | Pie or Doughnut Chart |
| Correlation Between Variables | Scatter Plot |

3. Simplify Your Data

To improve readability:
- Aggregate Data: If your dataset is large, consider summarizing or filtering it to focus on relevant points.
- Exclude Unnecessary Data: Remove any data that doesn't add value to your visualization.
🔍 Note: Reducing complexity in your dataset can significantly enhance the clarity of your graph, making trends and insights more apparent.
4. Customize Your Graph

Customization enhances understanding:
- Axis Titles: Add titles to axes to provide context to the graph.
- Data Labels: Show exact values on data points for precise readings.
- Legend: Include a legend when using multiple data series.
- Colors: Use contrasting colors to differentiate between data sets, but ensure they are accessible to all.
5. Dynamic Data Integration

Excel allows for dynamic integration:
- Use Formulas: Link your graph to formulas that update automatically as your data changes.
- Named Ranges: Define named ranges to simplify referencing data in charts.
6. Use Filters and Slicers

Make your graphs interactive:
- Filter: Implement filters to focus on specific data subsets.
- Slicers: Use slicers for interactive filtering, allowing viewers to explore data at their own pace.
💡 Note: Interactive elements like slicers not only make your charts user-friendly but also engage viewers in the analysis process.
7. Print and Export for Accessibility

For sharing and presentation:
- Optimize for Printing: Adjust your graph settings to fit onto standard paper sizes for easy printing.
- Export to Other Formats: Export your graphs to image formats like PNG, JPEG, or PDF for versatile use.
In summary, mastering the art of graphing in Excel can transform how you present and analyze data. By selecting the right data, choosing appropriate graph types, simplifying your data, customizing your graphs, integrating dynamically, and ensuring accessibility, you can create powerful visual narratives that tell a compelling data story. These quick tips serve as a foundational guide to get you started, but remember, the key to effective data visualization is experimentation and adaptation to your specific data needs.
What should I do if my graph looks cluttered?

+
Consider simplifying your data by aggregating or filtering out unnecessary details. Also, reducing the number of data points or choosing a different chart type might help de-clutter the visualization.
Can I automate graph updates in Excel?

+
Yes, you can automate updates by linking your graph to dynamic data sources or using formulas that automatically update as the underlying data changes.
How do I make my graphs accessible to all users?

+
Ensure your graphs are accessible by using high-contrast colors, providing text descriptions for color-blind users, and including alternative text for screen readers when exporting to image formats.


