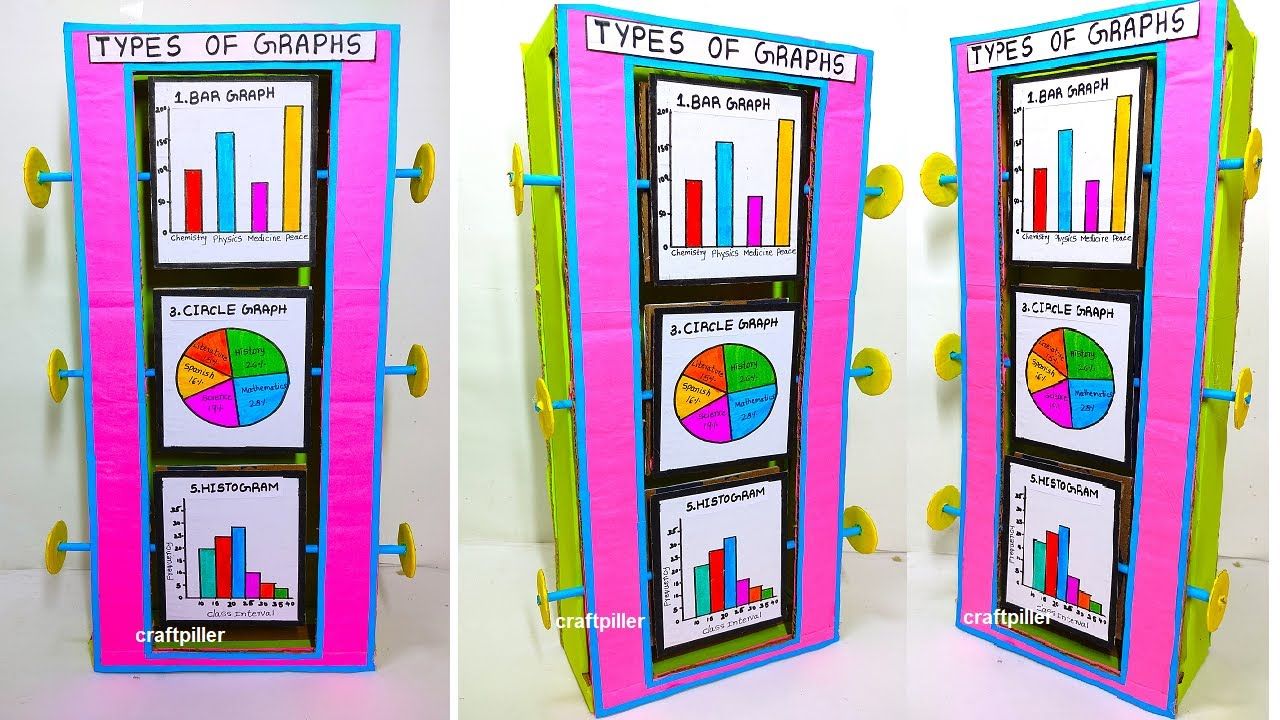
Draw Excel Graphs Easily: Step-by-Step Guide

Excel is not just a tool for managing spreadsheets; it's a powerful software for data visualization, especially through its graphing capabilities. Whether you're presenting data in a corporate meeting, analyzing trends for a research project, or simply tracking personal finances, knowing how to draw graphs in Excel can elevate your data presentation significantly. In this guide, we'll explore how to create various types of graphs in Excel, offering you a step-by-step approach to make your data tell a compelling story.
Understanding Excel's Graphing Features

Before we delve into the steps, it's worth noting what makes Excel a choice tool for data visualization:
- Wide Range of Graph Types: From pie charts to scatter plots, Excel offers a variety of graph types to match your data's story.
- Customizability: Graphs can be customized in terms of color, style, and labels to meet specific presentation needs.
- Dynamic Data Connection: Excel graphs update automatically as data changes, ensuring your visualization is always up-to-date.
Step-by-Step Guide to Creating Graphs in Excel

Preparing Your Data

The quality of your graph starts with the organization of your data:
- Ensure your data is in a tabular format with headers for each column.
- Remove any blank rows or columns from the data range to avoid errors in graphing.
Selecting the Right Type of Graph

Based on your data, choose the graph type:
- Column and Bar Graphs: Useful for comparing categories or time series data.
- Line Graphs: Perfect for showing trends over time.
- Pie Charts: Best for showing parts of a whole.
- Scatter Plots: To visualize the relationship between two numerical variables.
Let’s focus on creating a simple column graph:
Creating a Basic Column Graph

- Select Your Data: Highlight the cells containing the data you want to graph, including headers.
- Insert Graph:
- Go to the ‘Insert’ tab on the ribbon.
- Click on ‘Column’ or ‘Bar’ chart under ‘Charts’.
- Choose the basic 2-D column chart for simplicity.
- Adjust Graph:
- Click on the graph to activate the ‘Chart Tools’ menu at the top.
- Use the ‘Design,’ ‘Layout,’ and ‘Format’ tabs to customize your graph.
- Adding Chart Title:
- Click ‘Chart Title’ and choose ‘Above Chart.’
- Enter your desired title.
- Labeling Axes:
- Right-click the x-axis, select ‘Add Axis Title,’ and enter your label.
- Do the same for the y-axis.
- Modifying Legend:
- Click on the legend, and you can move or remove it as needed.
Advanced Customization

Once you have your basic graph:
- Colors and Styles: Use the ‘Chart Styles’ or ‘Change Colors’ options to change the look of your graph.
- Data Labels: Click ‘Chart Elements’ (the plus icon on the graph) to add data labels or change how they appear.
- Secondary Axis: If your data series need different scales, consider adding a secondary axis.
Saving and Sharing Your Graph

- Save: Always save your Excel workbook to retain your work.
- Copy to Other Applications: You can copy the graph as a picture or linked object to documents or presentations.
- Export: Use the ‘Save As’ option to export your graph as an image or PDF for various uses.
📘 Note: Excel graphs can be dynamically updated when data changes, ensuring your visualizations reflect the most current data.
In this comprehensive guide, we've covered the basics of how to create, customize, and share graphs in Excel. From selecting the right type of graph to customizing it to your presentation needs, Excel provides a user-friendly environment for all levels of users. By following these steps, you can transform raw data into visually appealing and informative graphs, making data analysis and presentation a much smoother process. Remember, while Excel offers a plethora of options, the key is to start simple and gradually add complexity as your understanding of your data's story grows.
Can I use Excel to make 3D graphs?

+
Yes, Excel supports 3D charts, but their use should be approached with caution. 3D charts can sometimes make data harder to read and interpret, but for specific visual needs, Excel provides options like 3D Column or 3D Pie charts.
What’s the best graph for comparing proportions?

+
For comparing proportions within a whole, a pie chart or a doughnut chart are usually recommended. They visually divide the total into parts, making it easier to grasp individual category contributions.
How do I ensure my graph updates when the data changes?

+
Ensure the data range for your graph includes all relevant cells. Excel will automatically update your graph when you change the data within this range. Additionally, if you move the graph to a different sheet or workbook, make sure the data links remain intact.


