5 Tips for Creating an Interactive Excel Sheet

Interactive Excel sheets can transform your data into dynamic and engaging tools that enhance user experience, improve data analysis, and streamline business processes. Here are five comprehensive tips to guide you through the process of creating an interactive Excel sheet:
1. Use Conditional Formatting for Visual Feedback


Conditional formatting is a powerful feature in Excel that allows you to apply specific formatting rules to cells based on their values or conditions.
- Highlight Cells: Use conditional formatting to automatically highlight cells that meet certain criteria, making it easier to spot trends, outliers, or changes in your data.
- Data Bars: Create visual bars within the cells that represent the value in comparison to other cells, providing an at-a-glance understanding of data distribution.
- Color Scales: Apply color gradients to your cells to illustrate data ranges, from low to high values, enhancing visual analysis.
💡 Note: Conditional formatting can significantly increase the file size if overused, so apply it judiciously.
2. Implement Drop-Down Lists with Data Validation

To make your Excel sheet more user-friendly, use data validation to create drop-down lists. This feature restricts input to predefined items, ensuring data accuracy and reducing input errors.
- Go to the cell where you want to add the drop-down list.
- Select Data > Data Validation from the menu.
- Choose List from the Allow drop-down, then enter your list of items or select a range on your sheet.
⚠️ Note: Avoid excessively long drop-down lists as they can become unwieldy on mobile devices.
3. Create Interactive Charts and Graphs


Excel charts can be interactive, updating dynamically with data changes or through the use of slicers, scroll bars, or form controls.
- Slicers: Use slicers for pivot tables to filter data visually. This allows users to slice and dice data with ease.
- Form Controls: Add scroll bars, spin buttons, or check boxes to control chart inputs dynamically.
- Dynamic Chart Ranges: Use formulas like OFFSET or TABLE to create charts that update automatically as data is added or removed.
4. Leverage Excel’s Hyperlinks for Navigation

Hyperlinks in Excel can turn your spreadsheet into a navigable environment:
- Internal Links: Use hyperlinks to jump to different sections or sheets within your workbook.
- External Links: Link to external resources or related documents, enhancing the document’s usability.
- Named Ranges: Combine hyperlinks with named ranges for quicker navigation to specific data points or sections.
🔗 Note: Overuse of hyperlinks can complicate the navigation if not structured thoughtfully.
5. Incorporate Macros and VBA for Automation

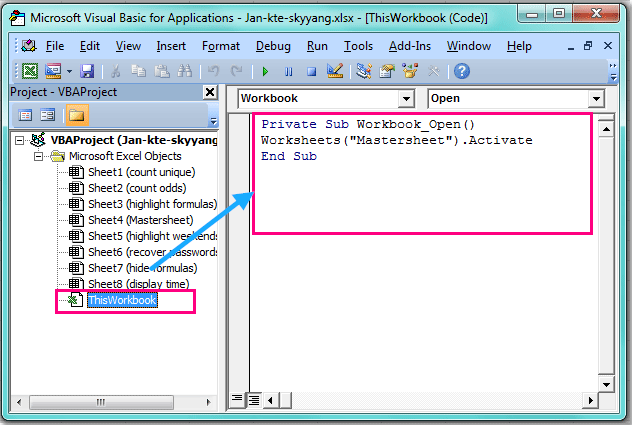
Visual Basic for Applications (VBA) allows you to automate tasks, create custom functions, and make your Excel sheet more interactive through:
- Automation of Repetitive Tasks: Develop macros that perform repetitive tasks or format cells automatically.
- Custom User Forms: Use VBA to create user forms for data entry, which can validate and process inputs on-the-fly.
- Event Handling: Write macros that trigger when certain conditions are met, such as changes in cells or worksheet activation.
In summary, transforming your Excel sheet into an interactive tool involves a blend of Excel's built-in features and some VBA programming. Start with conditional formatting to visually enhance your data presentation, utilize data validation for input control, and make charts dynamic to give users real-time insights. Additionally, use hyperlinks for seamless navigation within your workbook, and leverage VBA to automate and personalize user interactions. This not only improves the functionality but also the user experience, making data handling more intuitive and efficient.
What is conditional formatting in Excel?

+
Conditional formatting in Excel applies formatting to cells based on their values or conditions. This can include color changes, data bars, and icons to help visualize data trends and patterns.
Can I make Excel charts interactive without VBA?

+
Yes, you can make charts interactive without VBA by using features like slicers, pivot charts, or by setting up dynamic ranges using Excel formulas.
How can I ensure my Excel sheet is user-friendly?

+
To make your Excel sheet user-friendly, use clear labels, provide instructions, limit unnecessary complexity, and consider adding a dashboard or summary page with quick navigation options.


