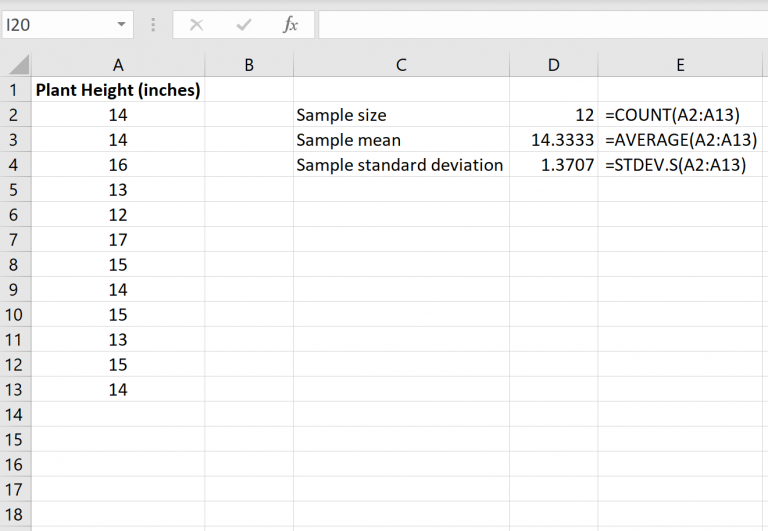
Calculating T-Tests in Excel: Step-by-Step Guide

In today's data-driven world, statistical analysis has become a critical tool for understanding data, making decisions, and testing hypotheses. One of the fundamental tools in this statistical toolbox is the T-test, which allows researchers, analysts, and students to compare means between two groups to determine if there is a statistically significant difference between them. Excel, with its widespread use and accessibility, offers a straightforward way to perform T-tests, making it accessible for users without a specialized statistical background. This guide will walk you through the process of calculating T-tests in Excel, ensuring you have the knowledge to analyze data effectively.
Understanding T-Tests

Before diving into the practical steps, let's briefly discuss what a T-test does:
- Compare two means: T-tests are used when you want to compare the means of two groups. This could be pre-test vs. post-test scores, treatment vs. control groups, or any two independent samples.
- Assumptions: The test assumes that the data are normally distributed and that the variances of the two groups are equal (for the standard T-test).
- Types of T-tests:
- Independent T-test: Used when comparing two separate groups.
- Paired T-test: Used when comparing means from the same subjects at two different times or under two conditions.
Step-by-Step Guide to Conducting T-Tests in Excel

Data Preparation

Ensure your data is organized in a way that facilitates analysis:
- Create two columns for your data sets if you're doing an independent T-test, or one column if performing a paired test.
- Label your columns clearly.
Using Excel's Data Analysis ToolPak

Install Data Analysis ToolPak
To use Excel's T-test functions:
- Go to
File > Options. - Click on
Add-Ins. - Select
Analysis ToolPakand clickGo. - Check the box for
Data Analysisand clickOK.
⚙️ Note: The availability of the Data Analysis ToolPak might depend on your version of Excel or the system language settings.
Performing the T-Test
Follow these steps:
- In Excel, go to the
Datatab, and click onData Analysis. - Choose
t-Test: Two-Sample Assuming Equal Variancesfor the independent T-test ort-Test: Paired Two Sample for Meansfor paired samples. - In the dialog box:
- Select the range for Variable 1 Range and Variable 2 Range.
- If you have labels, make sure the
Labelscheckbox is ticked. - Set the Hypothesized Mean Difference to 0 (assuming no inherent difference in means).
- Choose an output range where you want the results to appear.
- Click
OKto generate the T-test results.
Interpreting T-Test Results

Here's what you need to look at in the output:
| Output | Description |
|---|---|
| t Stat | The calculated t-value for your T-test. |
| P(T<=t) one-tail | The one-tailed p-value, relevant if your hypothesis is directional. |
| P(T<=t) two-tail | The two-tailed p-value, which is commonly used to assess significance. |
| Critical value for one-tail | The threshold value for the t-test to be significant at the specified alpha level (usually 0.05). |
| Critical value for two-tail | Same as above but for two-tailed tests. |
| Mean | The average values of each group. |
| Variance | The variance for each group, which you use to check assumptions. |

If your p-value is less than your alpha level (typically 0.05), you reject the null hypothesis, indicating a statistically significant difference between the means of your groups.
Going Beyond Excel's Default Tools

Excel's built-in T-test function assumes equal variances, but what if your data doesn't meet this assumption?
- Using the
T.TESTFunction: For more flexibility, you can use theT.TESTfunction in Excel. This allows for different tail types and can handle unequal variances:=T.TEST(array1, array2, tails, type)
where:array1,array2: Your data ranges.tails: 1 for one-tailed, 2 for two-tailed.type: 1 for paired, 2 for two-sample with equal variances, 3 for two-sample with unequal variances.
In wrapping up our discussion on calculating T-tests in Excel, we've explored a versatile tool that can help you analyze data with ease. From understanding the basic principles of T-tests to using Excel's built-in functionalities and going beyond them with custom functions, you're now equipped to perform T-tests confidently. Whether it's for academic research, business analytics, or personal data analysis, Excel's accessibility and depth make it an excellent platform for statistical tests like the T-test. Remember, the power of a T-test lies in its ability to validate or refute hypotheses with data-driven evidence. By following the steps outlined, you can ensure your data analysis is both rigorous and accessible, allowing you to make informed decisions or draw meaningful conclusions from your data sets. Keep experimenting, and always verify your results to ensure accuracy and reliability.
What if my data does not meet the assumptions of the T-test?

+
If your data violates assumptions like normality or equal variance, consider using alternative tests like the Mann-Whitney U test for non-parametric analysis or Welch’s T-test for unequal variances.
Can I perform a T-test with more than two groups?

+
No, T-tests are designed for comparing two groups. For three or more groups, you would use ANOVA (Analysis of Variance) followed by post-hoc tests if necessary.
Is it necessary to perform a T-test if the means look different?

+
Yes, because visual inspection alone isn’t enough. A T-test provides statistical evidence of whether the difference in means is due to chance or significant differences in the groups.


