5 Ways to Easily Add Tables in Excel

Adding tables to Excel can significantly enhance your data organization, analysis, and presentation. With tables, you not only get to organize your data more effectively but also gain access to Excel's powerful features like sorting, filtering, and automatic formatting. Here are five straightforward methods to insert tables into your Excel spreadsheets:
Using the Insert Table Feature


Excel provides an intuitive way to create tables directly from your data:
- Select your data range including headers.
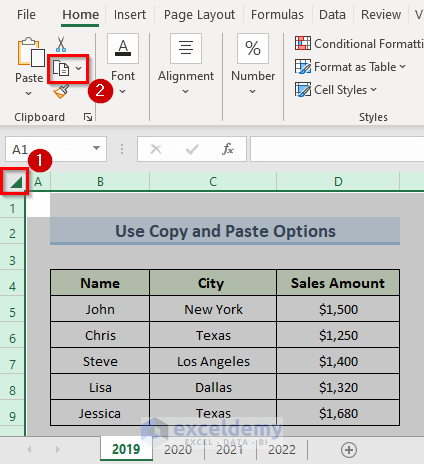
- From the Home tab, click Insert > Table or use the shortcut Ctrl + T.
- Check the box next to “My table has headers” if applicable and click OK.
This method instantly formats your selected data as a table with default styling, making it ready for additional functionalities.
Format as Table Option


If you prefer specific table styles:
- Select your data, including headers.
- Go to the Home tab, click Format as Table.
- Choose from the gallery of table styles and then confirm.
This allows you not only to convert your data into a table but also to apply your preferred visual style.
Quick Analysis Tool


For a quicker approach:
- After selecting your data, click on the Quick Analysis icon that appears at the bottom-right.
- Select Tables from the Quick Analysis options and click Table.
This method is especially handy for making instant decisions about table inclusion.
Manual Table Creation


If your data setup requires a custom approach:
- Type or insert your data into Excel, including headers.
- Highlight the range of cells you want to convert into a table.
- Click on the Insert tab and choose Table to manually define your table area.
This manual method gives you precise control over what data becomes your table.
From an External Source


Excel can also create tables from external data:
- Go to the Data tab.
- Choose your source like From Text, From Web, or From Other Sources.
- Import the data, and once in Excel, apply the table formatting.
This method is ideal when you need to work with data from different applications or databases.
Notes:
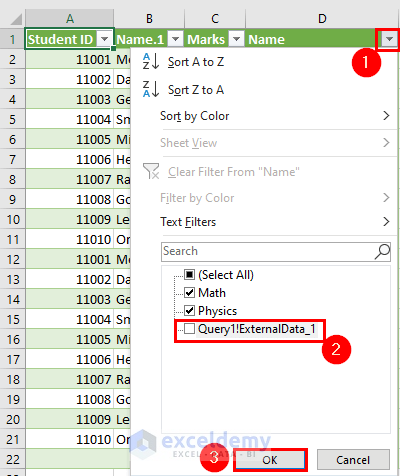
💡 Note: When you convert data into a table, Excel automatically applies alternating row colors, header row formatting, and enables features like filtering and sorting. This not only makes your data more visually appealing but also more functional.
📌 Note: If your data includes totals, averages, or other summary rows, make sure not to include these in your initial table selection as tables should only contain raw data for optimal use.
⚙️ Note: Tables in Excel expand automatically when you add more data to the cells below or beside the last cell of your table. Keep this in mind for data entry and management.
Incorporating tables into your Excel spreadsheets not only organizes your data but also provides a dynamic environment where you can quickly analyze, filter, and present information. Whether you're using Excel for personal finance, business analysis, or academic purposes, mastering table creation opens a door to more efficient data handling.
Why are tables useful in Excel?

+
Tables in Excel make data management easier by providing automatic filters, calculated columns, easier data analysis with sorting and formatting, and visual structure to your spreadsheets.
Can I convert an existing range of cells into a table?
+
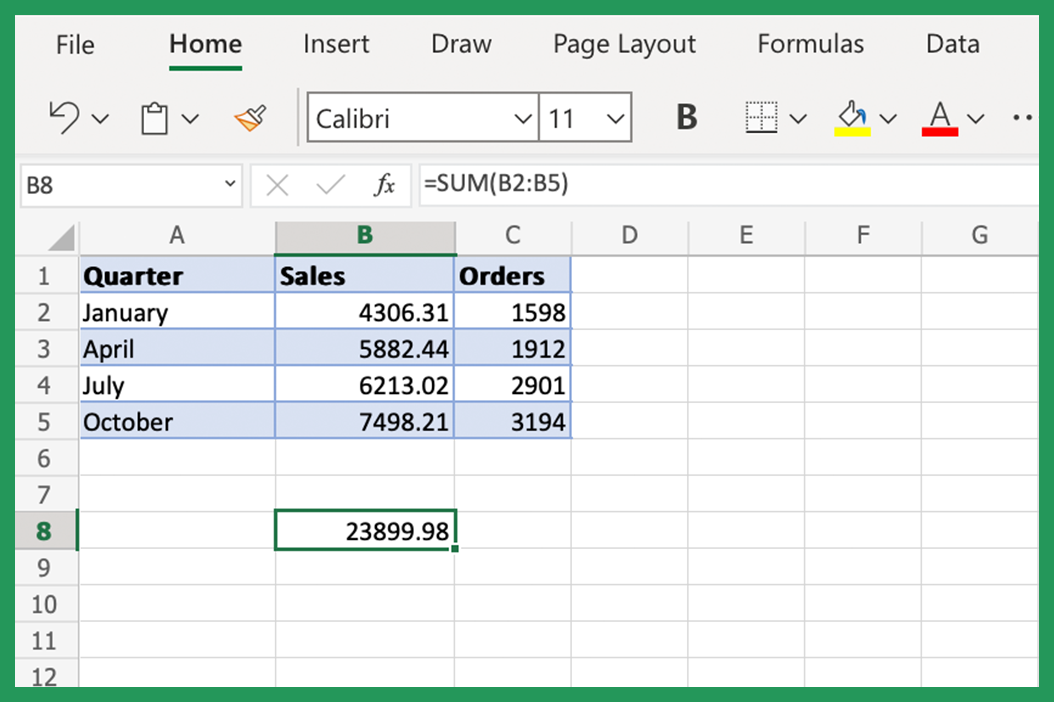
Yes, you can convert any range of cells into a table by selecting the range and using the methods described above. Remember to include headers for better functionality.
What happens if I add data below or beside the table?
+
Excel tables automatically expand to include new data, making data entry seamless. However, ensure your new data conforms to the existing structure of the table.
Is there a limit to how many rows or columns a table can have in Excel?

+
Excel has a row limit of 1,048,576 and a column limit of 16,384. As long as your table falls within these limits, there is no size restriction for tables.
Can tables in Excel be linked with charts or PivotTables?
+
Absolutely! Tables can serve as data sources for both charts and PivotTables, ensuring that any updates to the table data dynamically update related charts or tables.
