Mastering Excel: How Spreadsheets Function and Excel

Excel, part of the Microsoft Office suite, stands as one of the most robust and versatile tools for data management, analysis, and reporting. Over the years, its features have grown, offering users a blend of simplicity for beginners and complex functionalities for power users. Here's how you can master Excel, from its core functions to the advanced techniques that can enhance your productivity and data analysis skills.
Understanding Excel's Fundamentals

Before diving into complex features, it's essential to understand the basics of how Excel operates:
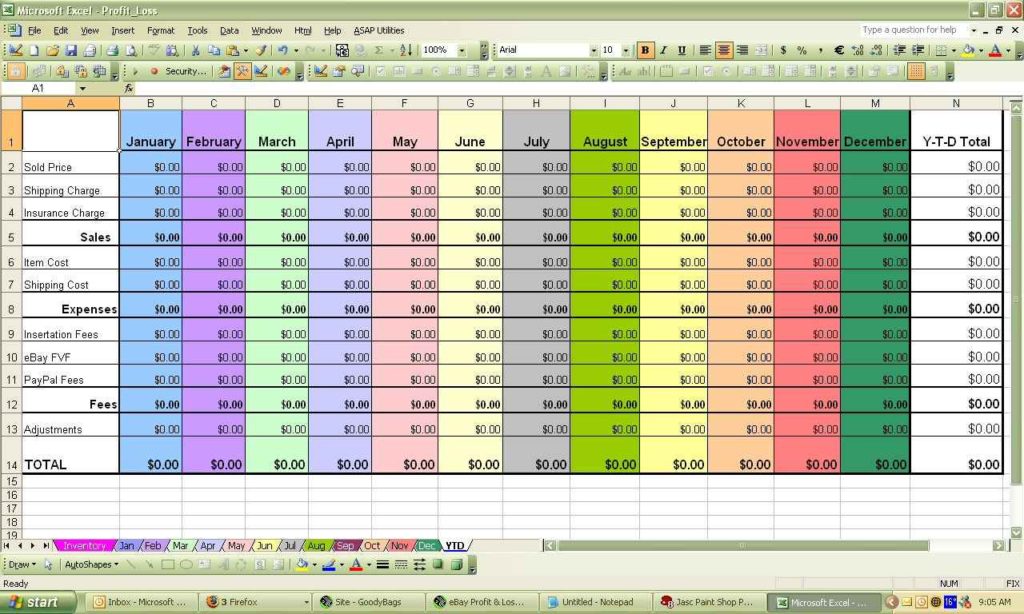
- Cells: The intersection of rows and columns, where you enter data.
- Worksheets: A single spreadsheet within a workbook.
- Workbook: An Excel file containing multiple worksheets.
- Formulas: Mathematical expressions that perform calculations in cells.
- Functions: Predefined formulas to perform specific calculations.
Navigating the Excel Interface


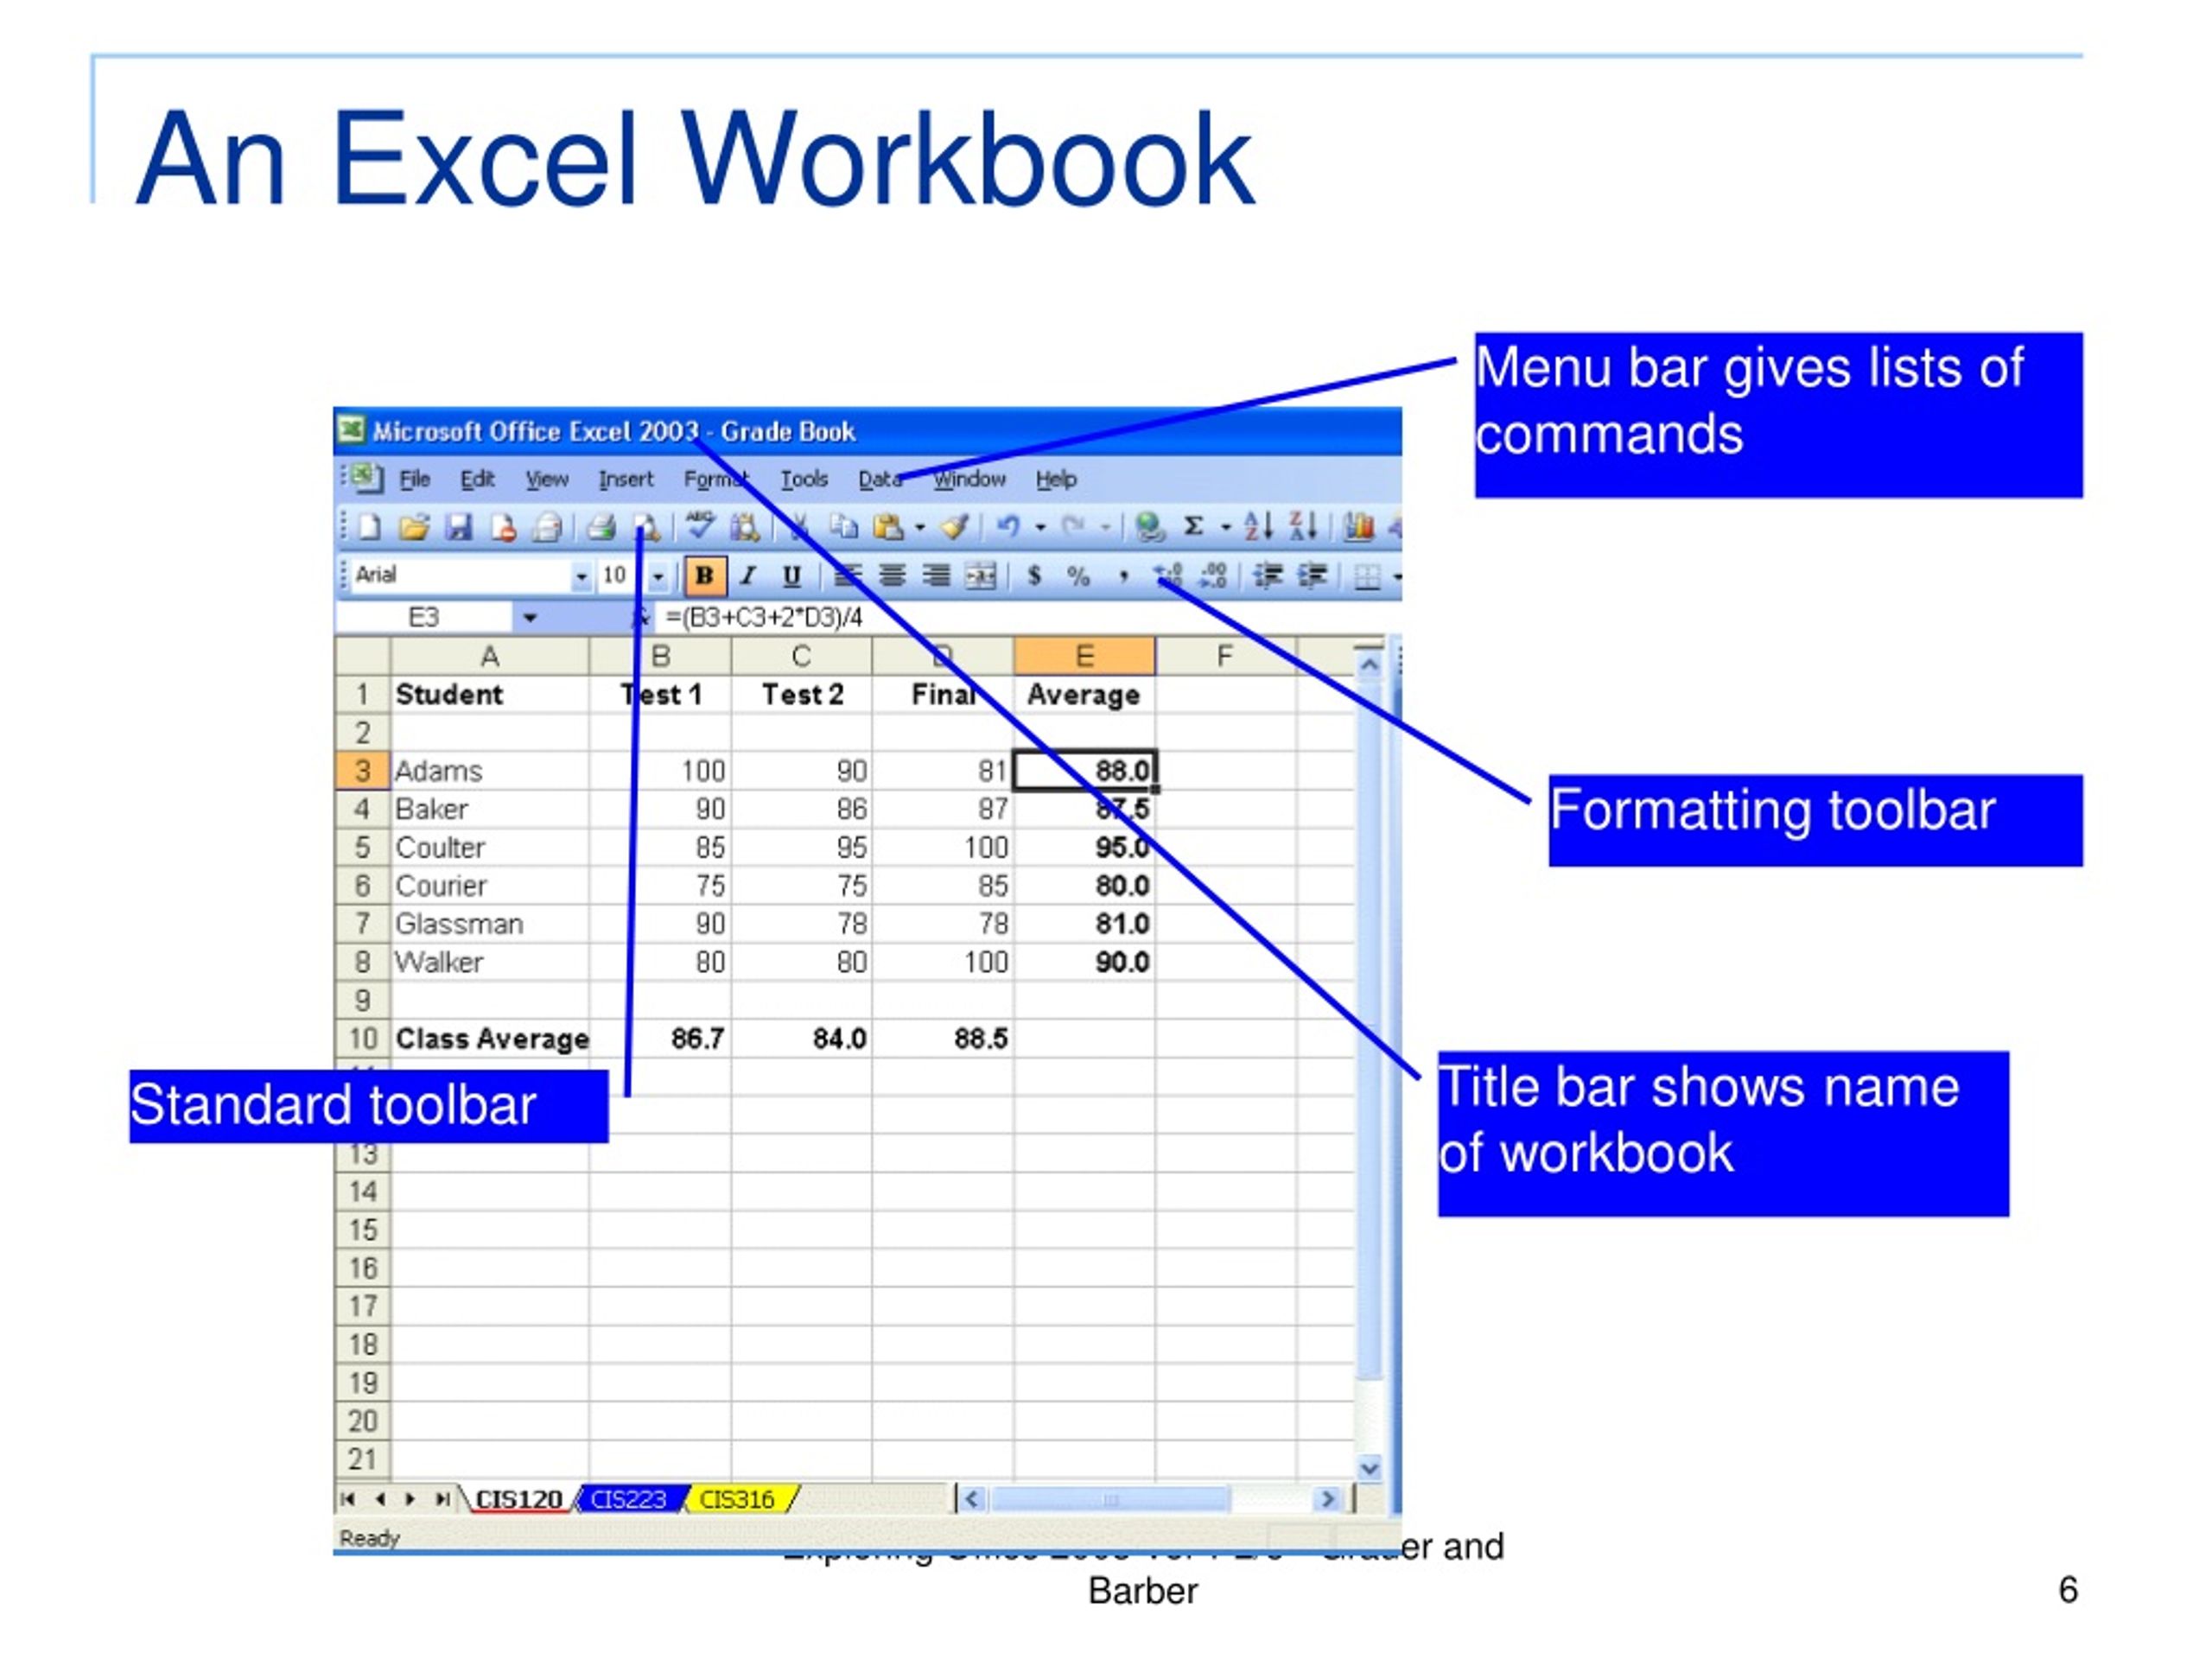
The Excel interface consists of several key components:
- Ribbon: Contains all commands grouped into tabs.
- Formula Bar: Shows the formula or value in the selected cell.
- Name Box: Indicates the current cell reference or range name.
- Sheet Tabs: Allow navigation between different sheets in a workbook.
Formulas and Functions

Excel's power lies in its ability to automate and perform complex calculations. Here’s how you can leverage formulas and functions:
Basic Formulas

=SUM(A1:A10)- Adds all numbers in cells A1 to A10.=AVERAGE(B1:B5)- Calculates the average of numbers in cells B1 to B5.=IF(A1>10, “Large”, “Small”)- Checks if the value in A1 is greater than 10 and returns “Large” or “Small”.
Advanced Functions

- VLOOKUP and HLOOKUP: Look up data horizontally or vertically in a table.
- INDEX and MATCH: More flexible lookups than VLOOKUP, allowing for two-dimensional searches.
- ARRAYFORMULA: Perform multiple calculations on one or more items in an array.
⚡ Note: To increase the efficiency of your workbook, consider using array formulas when you need to perform calculations on a range of cells.
Data Analysis with Excel

Excel provides various tools for data analysis:
PivotTables

PivotTables help summarize, analyze, explore, and present your data. Here’s how to create one:
- Select your data range.
- Go to Insert > PivotTable.
- Choose where you want the PivotTable to be placed.
- Drag fields to the Rows, Columns, Values, and Filter areas to analyze your data dynamically.
Power Query

Power Query enables you to connect, combine, and refine data from multiple sources. Use it for:
- Data transformation
- Automation of repetitive tasks
- Advanced filtering and sorting
Charting Your Data

Data visualization is crucial for interpreting data trends. Excel offers:
Types of Charts

- Column and Bar Charts - for comparing data across categories
- Line Charts - for displaying trends over time
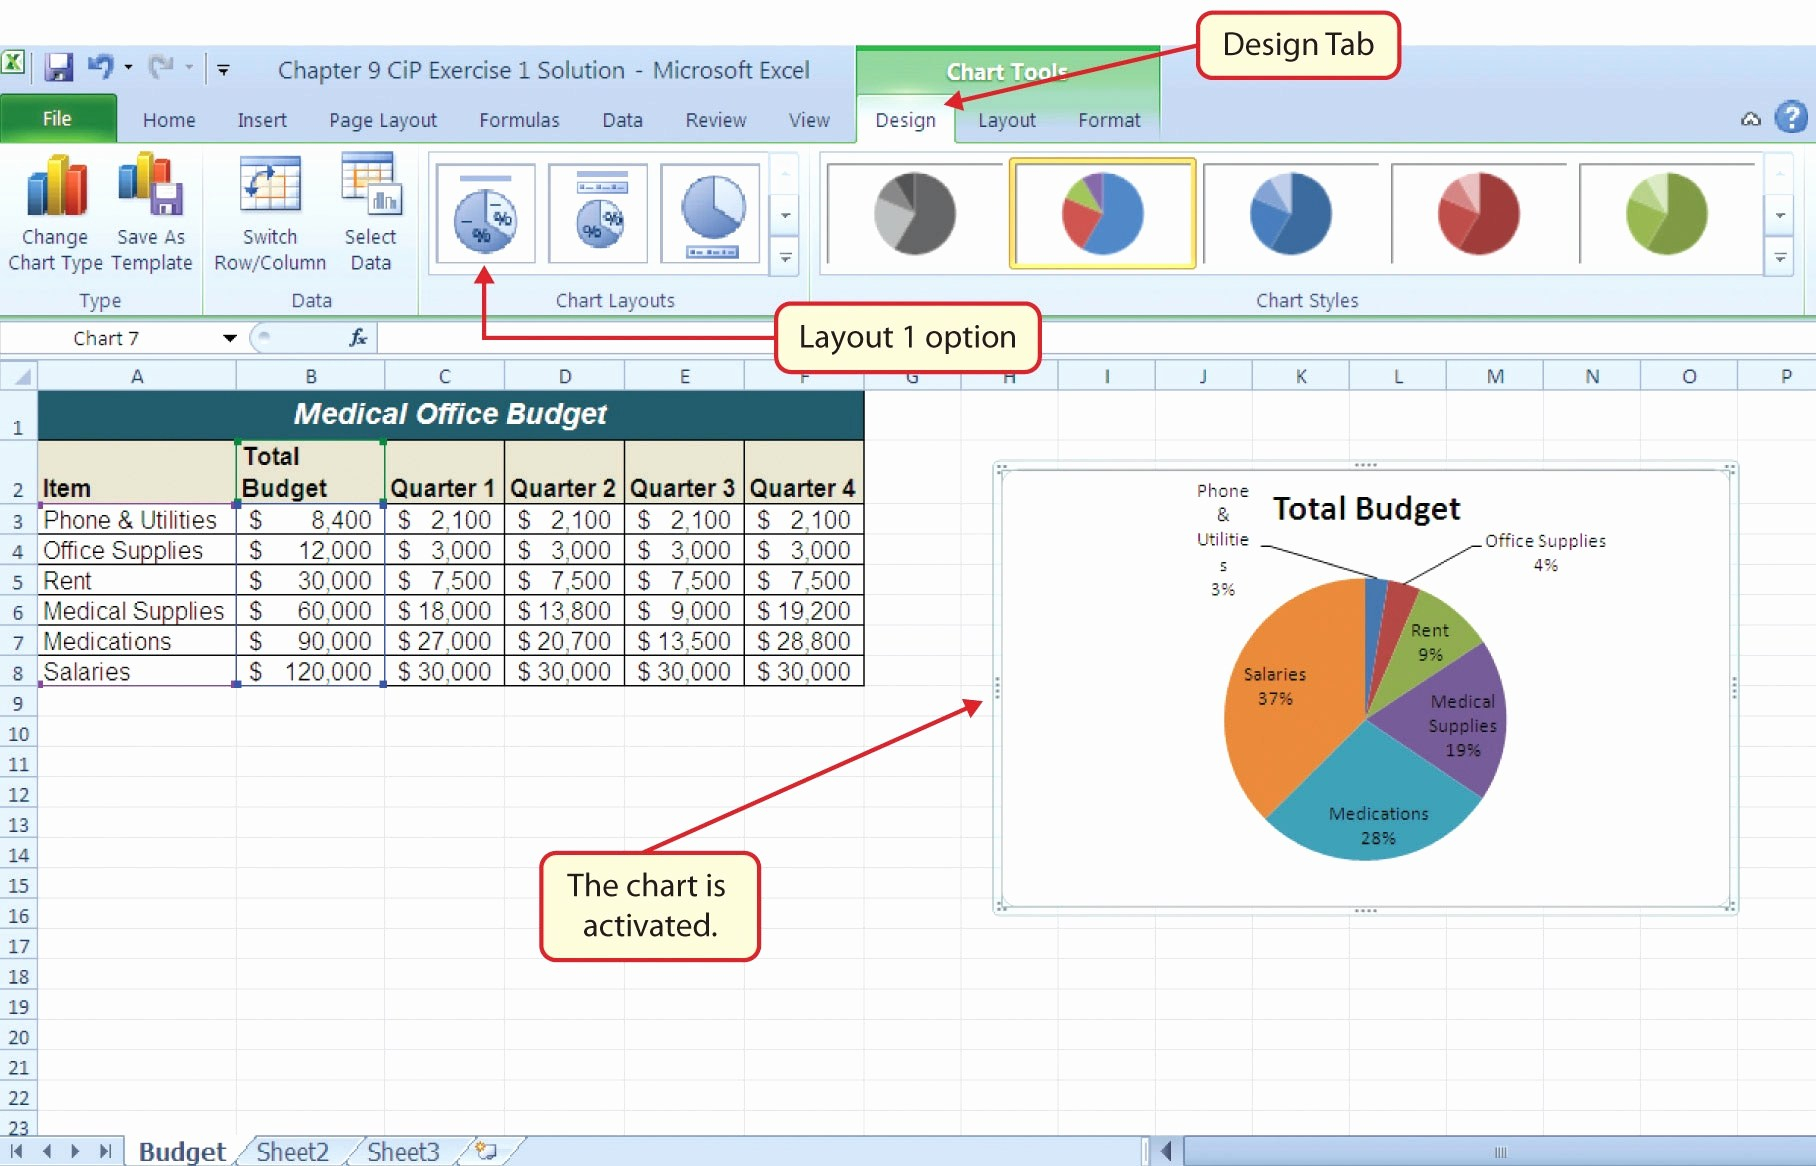
- Pie Charts - for showing parts of a whole
- Scatter Plots - for showing relationships between variables
To insert a chart:
- Select the data range.
- Go to Insert and choose the chart type.
- Customize the chart through the Chart Tools Design, Layout, and Format tabs.
Excel Automation with VBA

Visual Basic for Applications (VBA) allows you to automate tasks:
- Create macros to run repetitive tasks with a single command.
- Develop user-defined functions (UDFs) for custom calculations.
To start with VBA:
- Press Alt + F11 to open the VBA editor.
- Insert a new module.
- Write your VBA code or macro.
- Run your macro by assigning it to a button or a shortcut key.
💡 Note: While VBA can greatly increase productivity, be cautious with its use in shared workbooks due to security implications.
Maximizing Productivity

Here are some tips to make your Excel experience more efficient:
- Keyboard Shortcuts: Master shortcuts like Ctrl + C (copy), Ctrl + V (paste), Ctrl + Z (undo), and many more.
- Quick Analysis: Use the Quick Analysis tool for instant chart creation, formatting, and other analysis tasks.
- Data Validation: Set rules for what data can be entered into cells to ensure accuracy and consistency.
| Action | Shortcut |
|---|---|
| Open a new workbook | Ctrl + N |
| Insert a function | Shift + F3 |
| Select entire column | Ctrl + Spacebar |
| Format cells | Ctrl + 1 |

By understanding and utilizing these aspects of Excel, you can transform your approach to data handling, from simple spreadsheet management to complex data analysis and visualization. Whether you're managing finances, tracking projects, or analyzing research data, Excel's capabilities can be tailored to meet your needs, making your workflow smoother, faster, and more accurate.
What are the differences between VLOOKUP and HLOOKUP?

+
VLOOKUP searches for a value in the first column of a table and returns a value in the same row from another column. HLOOKUP does the same but looks for a value in the first row of a table and returns a value in the same column from another row.
How can I make my Excel files more secure?

+
To enhance security in Excel:
- Password protect your workbook.
- Use Excel’s built-in macro settings to manage VBA code execution.
- Disable automatic external data connections.
- Use data validation to control what data can be entered.
Can Excel handle large datasets?

+
Yes, Excel can manage large datasets effectively. Here are some tips for handling large data:
- Use Power Query for data import and transformation.
- Employ Excel Tables to improve calculation speeds and manage large data sets more efficiently.
- Utilize PivotTables for summarizing large amounts of data without slowing down your workbook.
- Consider Excel’s 64-bit version for better performance with large files.


