Create an Excel Summary Sheet: Easy Guide

Excel, with its robust features, is an essential tool for data analysis and management in both professional and personal settings. Among its myriad capabilities, one of the most useful functions is creating a summary sheet. This guide will walk you through the steps to efficiently produce a summary sheet in Excel, detailing how to gather, analyze, and display data in a clear, concise manner.
Understanding Summary Sheets

A summary sheet is essentially a consolidated report that provides a quick overview of the data from multiple sheets or workbooks. It helps in:
- Summarizing key performance indicators (KPIs).
- Compiling data from different sources for easier analysis.
- Tracking changes over time.
- Reporting to stakeholders without overwhelming them with details.
Step-by-Step Guide to Creating a Summary Sheet

1. Plan Your Layout

Before diving into Excel, take a moment to sketch your summary sheet layout:
- Define the purpose: What are the key metrics or data points you need to summarize?
- Identify data sources: Which sheets or workbooks will you pull data from?
- Consider the audience: Tailor the summary to meet the needs of your readers.
Note: A well-planned layout prevents clutter and makes your summary sheet visually appealing and functional.
2. Start a New Sheet for Summary

Open Excel and create a new worksheet where your summary will be compiled:
- Click the “+” button or press Shift + F11 to add a new sheet.
- Label it clearly, e.g., “Summary_2023”.
3. Import Data

Now, import data from your source sheets into this new summary sheet:
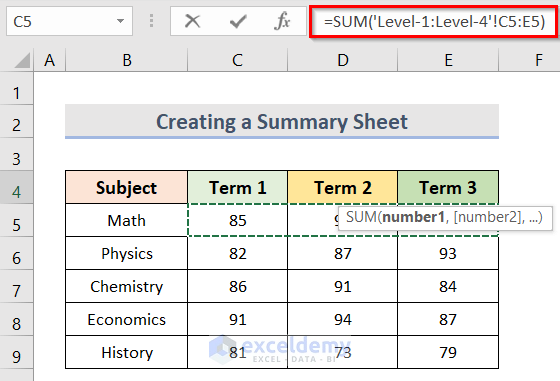
- Use formulas like
=Sheet1!A1to link directly to cells in other sheets. - Consider using the
VLOOKUP,INDEX, andMATCHfunctions for more complex data retrieval.
💡 Note: Ensure that your data sources are correctly named and formatted to avoid errors in referencing.
4. Aggregate Data

Once data is imported, start aggregating:
- Use Excel’s built-in functions like
SUMIF,AVERAGEIF, orCOUNTIFto calculate summaries. - Create pivot tables if dealing with large datasets for dynamic summarization.
5. Formatting for Clarity

A summary sheet is only useful if it’s readable:
- Use borders, colors, and font styles to highlight key information.
- Format cells appropriately - numbers should be formatted as numbers, dates as dates, etc.
- Add headers, titles, and explanatory notes for clarity.
6. Conditional Formatting

To make trends and critical data stand out:
- Apply conditional formatting to visually represent data through color scales, icon sets, or data bars.
7. Create Charts and Graphs

Summarize data visually by adding charts:
- Select your data, go to the “Insert” tab, and choose an appropriate chart type.
- Position the chart strategically within the summary sheet for easy interpretation.
8. Review and Finalize

Before sharing your summary:
- Check formulas for accuracy.
- Ensure the layout is logical and intuitive.
- Confirm that data from all sources is updated.
🔍 Note: Always double-check that the summary sheet reflects the latest data from your sources.
Tips for Better Summary Sheets

- Data Validation: Use Excel's data validation tools to ensure only valid data entries are made.
- Protecting Work: Lock cells with formulas to prevent accidental changes.
- Use Named Ranges: This makes formulas more readable and easier to maintain.
- Macros: For repetitive tasks, macros can save time and reduce errors.
Wrapping up, crafting a summary sheet in Excel can transform complex datasets into actionable insights. By planning your layout, importing and aggregating data accurately, and presenting it in a visually appealing manner, you create a powerful tool for analysis and decision-making. Remember to periodically update and maintain your summary sheets to ensure they continue to serve their purpose effectively. Whether for business analytics, financial reporting, or personal data management, Excel summary sheets are your gateway to making informed decisions based on comprehensive data overviews.
What is the main purpose of a summary sheet?

+
The primary purpose of a summary sheet is to consolidate and display key data points from multiple sheets or workbooks in a way that is easy to understand and analyze, allowing stakeholders to quickly grasp important trends, metrics, or changes without delving into the raw data.
Can I automate the process of updating my summary sheet?

+
Yes, by using Excel’s GETPIVOTDATA function, Power Query, or writing a VBA macro, you can automate updates in your summary sheet. Automation ensures your summary remains current with minimal manual effort.
How do I ensure the security of my summary sheet?
+To secure your summary sheet, you can:
- Use Excel’s password protection to secure the entire workbook or specific sheets.
- Hide formulas to prevent unauthorized changes.
- Restrict editing with worksheet protection settings, allowing only specific cells to be editable.


