5 Simple Ways to Display Lines in Excel Sheets

Excel is a powerful tool used by millions for data analysis, organization, and presentation. Whether you're a business analyst, a project manager, or a student, knowing how to effectively display and manage lines in your spreadsheets can significantly enhance your data's readability and aesthetics. In this blog post, we will explore five straightforward techniques to display lines in Excel sheets, making your data stand out while maintaining clarity and professionalism.
1. Gridlines

Gridlines are the faint lines that appear on your Excel sheet to help distinguish between cells. Here’s how you can ensure they are visible:
- Open your Excel workbook.
- Navigate to the "View" tab.
- Check the Gridlines checkbox under the "Show" group to display gridlines.
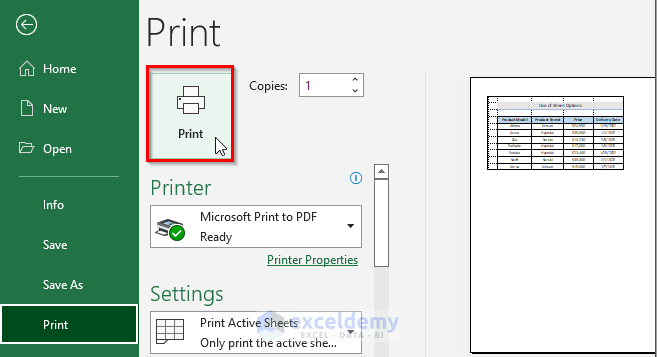
If you need to print your sheet with gridlines:
- Go to the "Page Layout" tab.
- In the "Sheet Options" group, check the Print Gridlines box.
✅ Note: Gridlines are only visible when working on the sheet; they do not affect the data or its formatting. If gridlines are not visible, check if they have been turned off by accident.
2. Borders

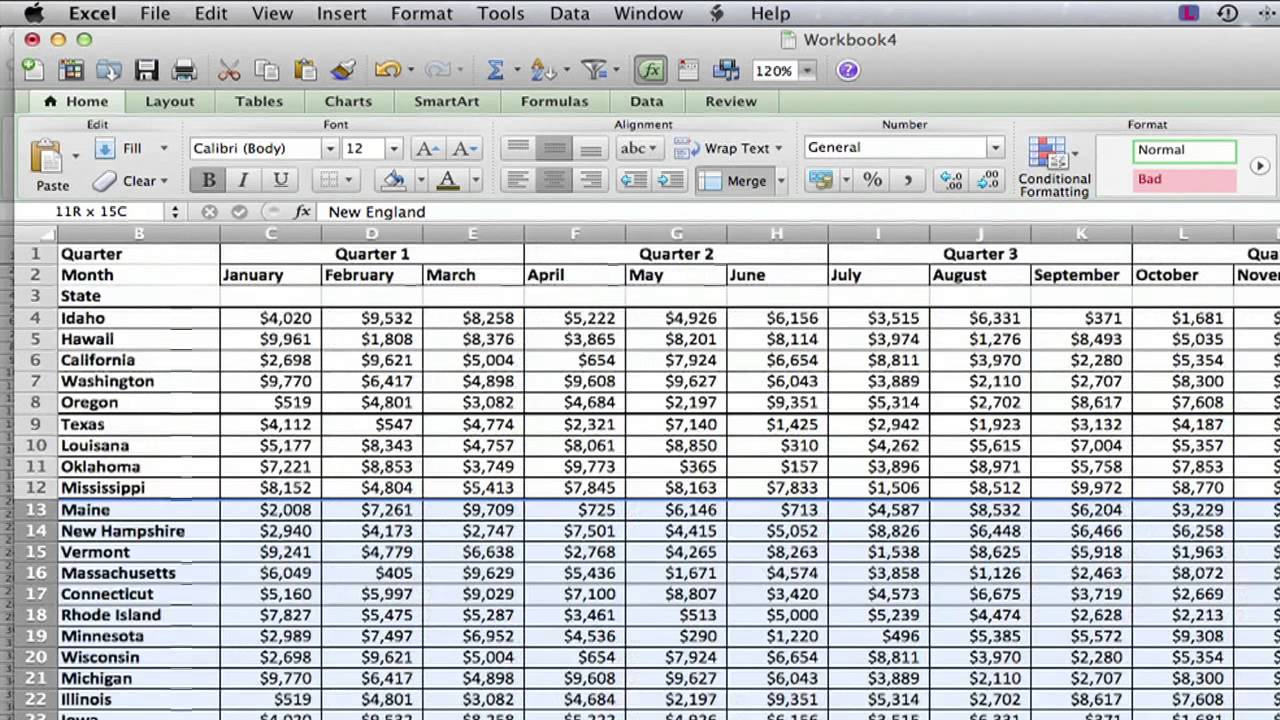
Borders are more defined than gridlines and can be customized in style, color, and thickness. Here are the steps to add borders:
- Select the cells where you want to apply borders.
- From the "Home" tab, under the "Font" group, click the Borders dropdown arrow.
- Choose from options like All Borders, Outside Borders, or customize your border by selecting More Borders....
You can also use the Format Cells dialog:
- Select the cells.
- Press Ctrl+1 or right-click and choose Format Cells.
- Go to the Border tab for a more detailed customization.
✅ Note: Borders can be used to highlight specific data, outline totals, or demarcate different sections within your sheet.
3. Line Sparklines

Sparklines are mini charts within a cell that give a quick visual summary of your data trends. Here’s how to add line sparklines:
- Select the cell where you want the sparkline to appear.
- Go to the "Insert" tab and click on Line under the "Sparklines" group.
- Choose the data range for the sparkline in the dialog box and hit OK.
You can adjust the appearance by:
- Selecting the sparkline cell.
- Under the "Sparkline Tools" group on the ribbon, adjust settings like Markers, High Point, Low Point, etc.
4. Drawing Lines

For manual control over where lines appear, you can use the drawing tools:
- Go to the "Insert" tab.
- Select Shapes, then choose Line.
- Click and drag on your worksheet to draw the line.
- Right-click the line, choose Format Shape to customize line color, width, and style.
✅ Note: Use drawing lines sparingly as they can clutter the sheet if overused.
5. Excel’s Advanced Line Formatting

Excel allows you to apply lines to individual cells or ranges, giving your sheet a professional and organized look:
- Select the cells or range where you want to add advanced lines.
- Go to Format Cells (Ctrl+1).
- Under the Border tab, customize your lines by:
- Selecting line style.
- Choosing line color.
- Applying lines to specific sides of the cells.
This approach is perfect for:
- Highlighting key figures.
- Creating clear separations between data sets.
- Making certain data rows or columns stand out.
In summary, mastering these five techniques will not only help in managing lines for better readability but also in visually separating or emphasizing data within your Excel sheets. Whether you’re preparing reports, charts, or organizing information, Excel’s versatility in displaying lines can transform a simple spreadsheet into a professional-grade presentation.
What is the difference between gridlines and borders in Excel?

+
Gridlines are the default faint lines that separate cells to aid in data entry and visibility, whereas borders can be customized to add color, style, and thickness to highlight specific data or sections of your sheet.
Can I make gridlines visible when I print my Excel sheet?

+
Yes, by navigating to the “Page Layout” tab and checking the “Print Gridlines” box under “Sheet Options,” you can make gridlines appear when your Excel sheet is printed.
How can I quickly customize borders for a selection of cells?

+
Use the “Format Cells” dialog. Select the cells, press Ctrl+1, go to the “Border” tab, and adjust the line style, color, and placement to suit your needs.


