Move Your Excel Plot to a New Sheet Easily

Are you tired of struggling with moving charts and graphs in Microsoft Excel? Maybe you've found yourself lost in the maze of menus and settings trying to organize your data presentation efficiently. This guide will walk you through the simple yet essential steps to move your Excel plot to a new sheet, ensuring your work is both organized and visually appealing.
Why Move Your Excel Plot?

Before diving into the technical process, it’s worth understanding why you might need to move your Excel plot:
- Clarity: A separate sheet for charts can make presentations clearer and more professional.
- Focus: Data and graphs side by side can be confusing. Moving the plot allows viewers to focus on one at a time.
- Easy Reference: If your workbook contains multiple charts, keeping them in their dedicated sheets makes navigation simpler.
Step-by-Step Guide to Moving Your Plot to a New Sheet

1. Open Your Excel Workbook

Launch Microsoft Excel and open the workbook containing your plot. Ensure the sheet with the chart is active.
2. Select Your Chart


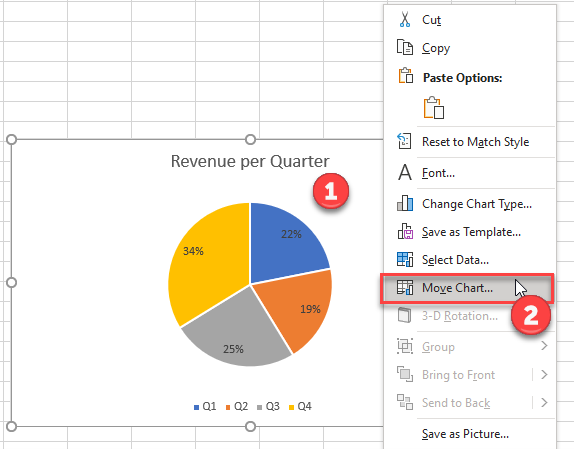
Click on your chart to select it. You’ll know it’s selected when it’s surrounded by a blue border and resizing handles.
3. Move Your Chart

Right-click on the selected chart and choose Move Chart from the dropdown menu.
3.1 The Move Chart Dialog Box
A small window titled “Move Chart” will appear, where:
- Under Object in:, choose New Sheet.
- Give your new sheet a meaningful name, like “ChartSheet” or “Graphs.”
💡 Note: Ensure your new sheet name doesn't conflict with existing sheet names.
4. Confirm the Move

After naming your new sheet, hit OK. Excel will now create a new sheet containing only your chart.
5. Check and Customize


Once the chart is in its new home, you can:
- Adjust the chart’s size and position to fit the new sheet.
- Make any necessary changes to the chart’s appearance or data source.
- Use the new space for adding extra elements like titles, legends, or additional charts.
Summing up, moving your Excel plot to a new sheet is not just about organization; it's about enhancing the viewer's experience by providing clear, focused visuals. By following this guide, you can make your data presentation not only professional but also significantly more intuitive for your audience. The next time you need to move a chart or create a dashboard, remember these steps to streamline your Excel workflow.
Why should I move my Excel chart to a new sheet?

+
By moving your chart to a new sheet, you can separate your data analysis from your visual representations, making it easier to focus on either aspect individually. This separation can enhance presentation clarity, make navigation smoother, and allow for a more professional layout of your work.
Can I move multiple charts to a single new sheet?

+
Yes, you can move multiple charts to the same new sheet. Just repeat the process for each chart you wish to move. Remember to name each chart uniquely for easier identification if you have several on the same sheet.
How do I adjust the chart if I change my data after moving it?

+
To reflect changes in your data, simply go back to the original data sheet, update the data, and then return to the chart sheet. Excel will automatically update the chart to reflect these changes provided the data range is the same.
Can I revert the chart back to its original sheet?

+
Yes, you can move the chart back to its original location by selecting the chart, right-clicking, and choosing “Move Chart” again. Then, select the original sheet from the dropdown menu under “Object in:” and click OK.


