Excel Project Report: Step-by-Step Guide

In the era of data-driven decision-making, knowing how to report your project progress through tools like Microsoft Excel is crucial. This comprehensive guide will walk you through crafting a detailed project report using Excel, ensuring that your stakeholders understand project statuses, timelines, and outcomes in a clear and visually engaging manner.
Why Use Excel for Project Reporting?


Excel is a versatile tool when it comes to managing and reporting project data. Here are some reasons to choose Excel:
- Accessibility: Nearly everyone has access to Excel, making it a universal choice for project reporting.
- Flexibility: Customize your reports to fit the unique needs of your project with Excel’s vast array of functions and formulas.
- Visual Data Presentation: Charts, graphs, and tables can transform complex data into understandable visuals.
- Collaboration: Share and collaborate on Excel files, which are compatible with cloud storage solutions like OneDrive.
Setting Up Your Excel Workbook

Before diving into the details, set up your Excel workbook:
- Create a new workbook and save it as “Project Report [Date]”.
- Name your sheets appropriately, such as “Overview”, “Timeline”, “Risks”, “Budget”, and “Summary”.
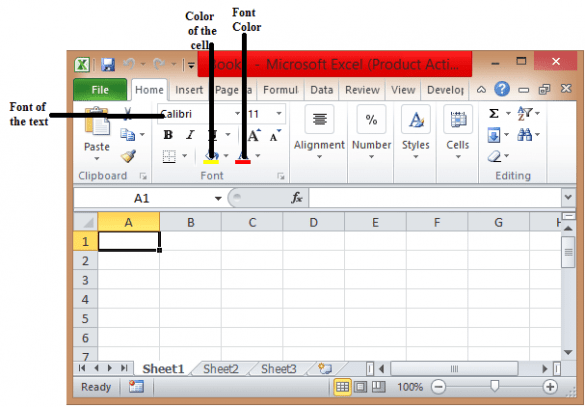
- Set up your title cells in bold, use headers, and employ different colors for better readability.
Inputting Project Data

To start your project report:
- Project Overview:
- Enter project name, start date, end date, project manager, and key stakeholders.
- Include a brief project description, objectives, and current status.
- Timeline:
- Input your project milestones, due dates, and current status in separate columns.
- Use conditional formatting to highlight overdue or at-risk tasks.
- Tasks and Progress:
- List all project tasks, assignees, and progress percentages.
- Include planned vs. actual start and end dates for each task.
- Budget:
- Enter budget estimates, actual costs, and variance.
- Use Excel functions to calculate total costs and remaining budget.
📝 Note: Use relative cell references for calculations when you plan to extend your report. This ensures your formulas work with new data entries.
Visualizing Your Data

Visual aids can significantly improve the comprehensibility of your project report. Here are some methods:
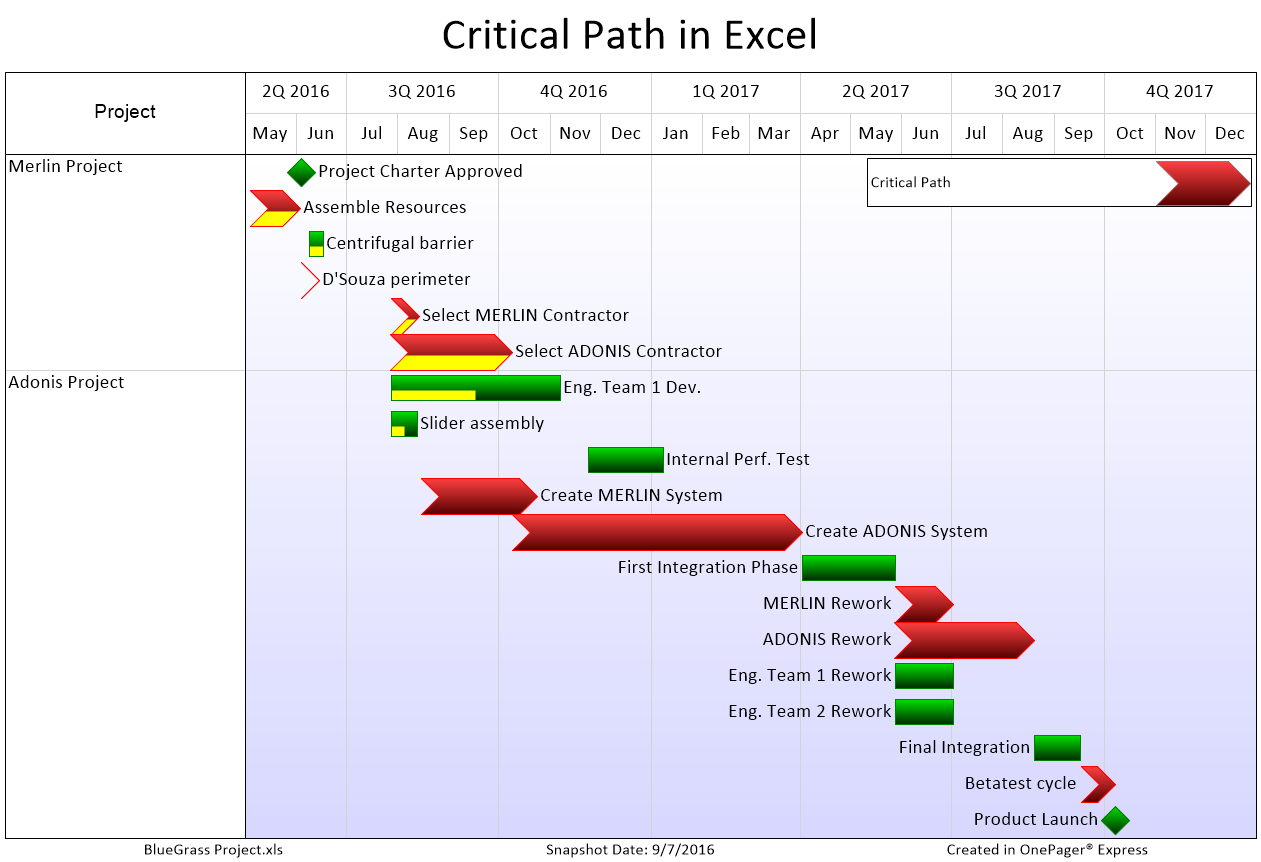
- Gantt Chart: Create a visual timeline for tasks and their duration using the Gantt Chart template in Excel.
- Pie Chart: Use for budget distribution or project completion percentage.
- Bar Graph: Show progress over time or compare planned vs. actual task completion.
Creating an Interactive Dashboard

An interactive dashboard can engage your audience and allow them to explore data interactively. Here are steps to set one up:
- Create a “Dashboard” sheet in your workbook.
- Add data from other sheets using Excel’s PivotTables and Charts for real-time updates.
- Include dynamic filters for sorting by dates, team members, or task status.
- Use conditional formatting to highlight critical data points.
🔍 Note: Ensure your dashboard is accessible by maintaining a logical flow of information and using user-friendly interface elements.
Finalizing Your Report

Before presenting your report:
- Review all data for accuracy and completeness.
- Check all formulas for correctness and unintended errors.
- Adjust chart titles, legends, and labels for clarity.
- Add a summary sheet with key findings and a project health status.
In closing, crafting a project report in Excel not only organizes your project information effectively but also presents it in a way that's comprehensible to all stakeholders. Excel's flexibility and analytical capabilities make it an excellent choice for project management. By following these steps, you can ensure your project report communicates the right messages, highlights progress, and identifies potential risks, allowing for better decision-making and project oversight.
What are some best practices for Excel project reporting?

+
Best practices include maintaining data integrity, using clear labeling, leveraging visual aids, and ensuring the report is easily digestible by stakeholders.
How can I share my Excel project report?

+
You can share through email attachments, OneDrive with collaboration features, or export it to PDF for easy viewing without Excel.
Is Excel sufficient for all project reporting needs?

+
Excel is great for small to medium-sized projects. For large or complex projects, consider using specialized project management tools in conjunction with Excel.


