5 Easy Steps to Create an Excel Results Sheet

Creating an Excel results sheet might seem daunting at first, but with a clear understanding of Excel's functionalities, you can manage it effectively. Whether you're organizing sports scores, academic results, or sales data, this guide will walk you through 5 easy steps to create an Excel results sheet with seamless efficiency.
Step 1: Open Excel and Prepare Your Sheet

Start by opening Microsoft Excel. Here’s how to set up your initial sheet:
- Open Excel and create a new blank workbook.
- Select cells and merge them for headings like “Student Name”, “Marks”, and “Grade”.
- Adjust column widths for better readability by right-clicking the column header and selecting “Column Width.”
📝 Note: Ensure that your Excel version supports all the features discussed in this guide.
Step 2: Input Data

Now that your sheet is structured, you can start entering data:
- Type in the titles or categories (e.g., Student ID, Test Number) into the first row.
- Enter the corresponding data in subsequent rows. For example:
Student ID Test 1 Test 2 123 85 77 
📝 Note: Consistency in data entry is crucial for accurate calculations later.
Step 3: Calculate Results

To automate grading and calculate results, use Excel’s formula capabilities:
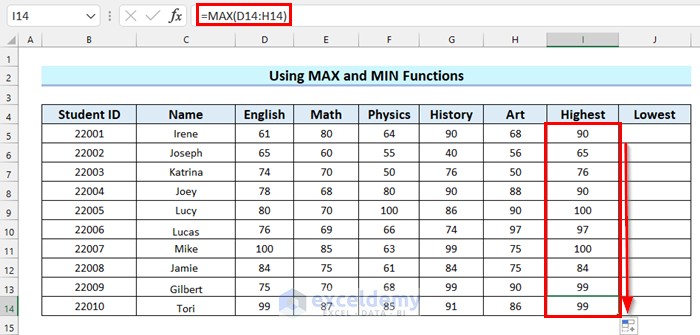
- Sum up the total marks using the SUM function:
=SUM(B2:C2)if marks are in column B and C. - Calculate the average with AVERAGE:
=AVERAGE(B2:C2)for a final score. - Use IF or nested IF statements to assign grades based on scores:
=IF(B2>80, “A”, IF(B2>65, “B”, IF(B2>50, “C”, “F”)))
📝 Note: You can combine multiple functions to make more complex grading schemes.
Step 4: Enhance Visual Presentation

Enhancing your Excel sheet’s visual appeal not only makes it more readable but also highlights critical information:
- Select the relevant data range and use the Conditional Formatting feature to color-code scores.
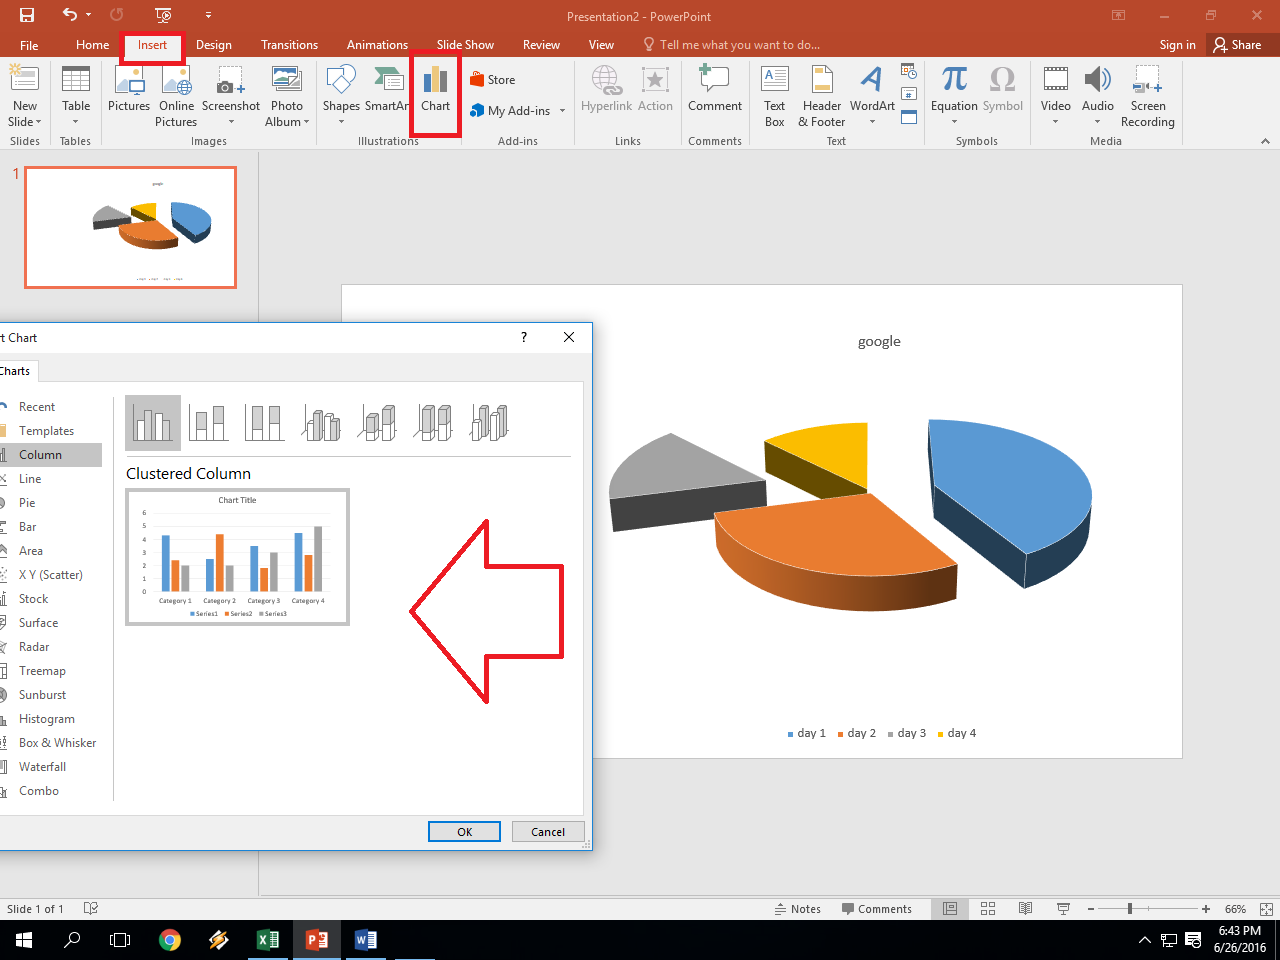
- Employ charts like bar or pie charts to visually represent data.
Step 5: Final Touches and Distribution

Before sharing your Excel results sheet:
- Double-check all entered data and formulas for accuracy.
- Use Freeze Panes to keep row or column headers visible while scrolling.
- Secure the sheet by protecting it with a password under the Review tab if needed.
- Save your workbook, considering options like Excel Binary Workbook for large files.
By following these 5 steps, you've created an Excel results sheet that's functional, visually engaging, and easy to distribute. Remember to maintain data consistency, leverage Excel's formula capabilities for dynamic updates, and ensure readability through formatting. Excel offers endless possibilities for managing, analyzing, and presenting data in various formats, making it an invaluable tool for educators, businesses, and enthusiasts alike.
Can Excel calculate percentages for grades?

+
Yes, you can use the formula =SUM(Score_Cell/Total_Points)*100 to calculate the percentage. Just replace Score_Cell with the cell where the score is and Total_Points with the total possible points.
How can I share my Excel results sheet with others?

+
You can either save the file and send it through email, use cloud storage services like OneDrive for real-time collaboration, or export it to a PDF for viewing without Excel.
What if my Excel sheet needs to handle complex grading schemes?

+
Excel supports complex calculations with advanced functions like VLOOKUP or INDEX/MATCH, or you can even use VBA scripting for more customized solutions.


