5 Tips for Creating Excel Sheets for Tableau

When it comes to data analysis, visualization, and business intelligence, Tableau has become a household name. However, for Tableau to perform at its best, the data provided needs to be clean, well-structured, and optimized. This preparation often starts with Excel, the most widely used spreadsheet tool. In this detailed guide, we'll explore five essential tips for creating Excel sheets that will enhance your experience when importing and visualizing data in Tableau.
Tip 1: Clean Your Data
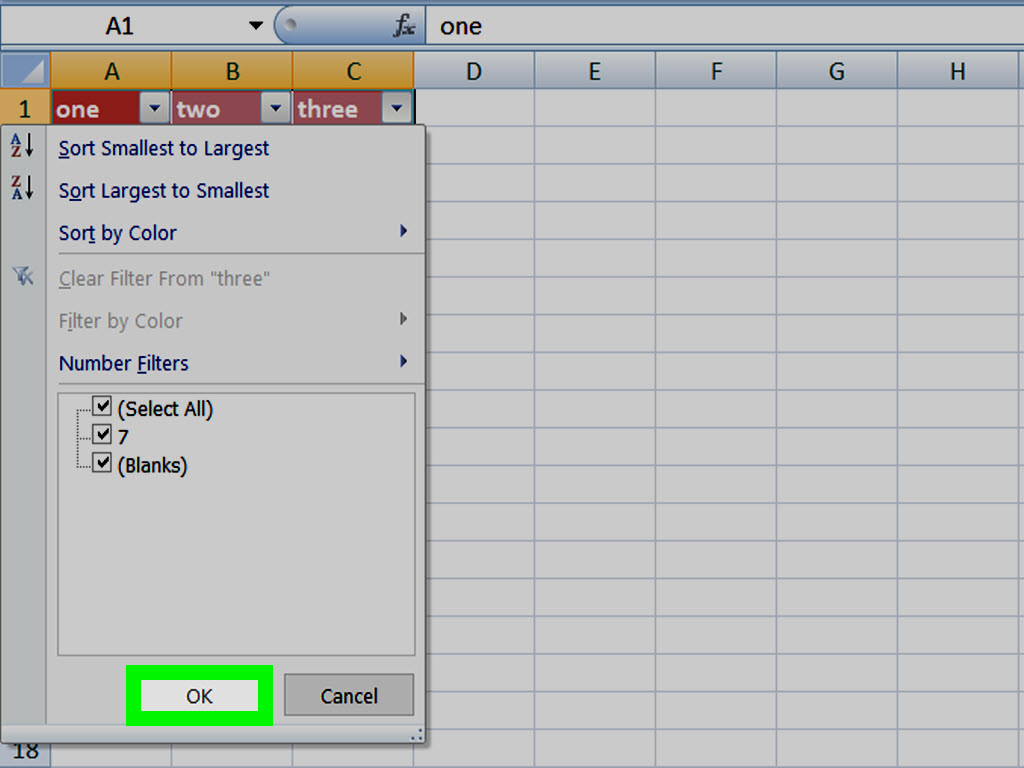
Data cleaning is the first and one of the most critical steps in preparing your Excel sheets for Tableau.
- Remove Blank Rows and Columns: Blank cells can disrupt Tableau’s ability to recognize your data as a continuous dataset.
- Fix Formatting Inconsistencies: Ensure that numbers are consistently formatted as numbers, dates as dates, and text as text. This uniformity aids in accurate data interpretation.
- Eliminate Duplicates: Use Excel’s built-in tools or filters to remove any duplicate entries, preventing data redundancy.
- Consistent String Case: Standardize the capitalization of text in your headers and data to avoid issues with sorting and matching.
🧹 Note: Data cleaning is not just about making your data look nice; it’s about ensuring accuracy and reliability in your analytics.
Tip 2: Use Proper Data Structure

How you structure your data in Excel will directly influence how well Tableau can analyze and visualize it:
- Ensure Header Rows: Each column should have a header row at the top that clearly describes the data it contains. This aids in field recognition in Tableau.
- Use Consistent Date Formats: Stick to one date format throughout your spreadsheet to avoid confusion.
- Limit to One Data Type per Column: Keeping each column dedicated to one type of data (like numbers or dates) helps maintain clarity and simplifies analysis.
| Recommended Structure | Tableau Impact |
|---|---|
| One header row at top | Improved data field recognition |
| Consistent formatting | Prevents data type errors in Tableau |
| Single data type per column | Simplifies data parsing and visualization |

Tip 3: Implement Proper Excel Formulas

Formulas in Excel can simplify your data management process before importing it into Tableau:
- VLOOKUP and INDEX/MATCH: These formulas can link data from different sheets or workbooks, creating a more comprehensive dataset.
- IF Statements: To categorize or conditionally format data for easier analysis in Tableau.
- Pivot Tables: Useful for summarizing data but remember to use ‘GetPivotData’ to retain pivot structures when exporting to Tableau.
⚠️ Note: Avoid overly complex formulas in Excel that might not translate correctly in Tableau. Keep it simple where possible.
Tip 4: Naming Conventions and Organization

Good naming conventions help in understanding your Excel sheets, especially when dealing with multiple datasets or large files:
- Column and Sheet Names: Use descriptive, concise names for columns and sheets, avoiding spaces and special characters which could create issues in Tableau.
- Data Folders: Organize your files in a structured folder system to quickly locate and load the correct data into Tableau.
- Date Stamping: Include date stamps in file names to track version changes over time.
Tip 5: Save and Prepare for Import

Finally, your data needs to be ready for import into Tableau:
- Save As Excel (.xlsx): Ensure your file is saved in the correct format for Tableau to read.
- Validate and Test: Check for any errors, ensure all data is present, and test import into Tableau to catch any structural or formatting issues.
- Use Minimal Formatting: Keep your Excel formatting minimal to avoid complications in Tableau. Use conditional formatting in Tableau for visual cues.
📊 Note: Remember that while Excel is powerful, Tableau has its own formatting tools, so leverage those for the best visualization results.
By applying these tips for creating Excel sheets optimized for Tableau, you ensure a smooth and efficient data analysis process. Well-prepared data can lead to better visualizations, more accurate insights, and ultimately, a more impactful presentation of your findings. Remember, the journey from raw data to compelling data stories starts with the right foundation in Excel.
Why is cleaning data important before using Tableau?
+
Data cleaning ensures accuracy, eliminates redundancies, and maintains consistency, allowing Tableau to process and visualize data efficiently.
What is the best way to structure data for Tableau?

+
Ideally, data should be in a tabular format with headers, consistent data types, and dates formatted uniformly for seamless integration with Tableau.
Can complex Excel formulas affect Tableau performance?

+
Yes, overly complex formulas can lead to performance issues or incorrect data interpretation in Tableau. It’s best to keep formulas simple.
How should I name my files and sheets for Tableau?

+
Use clear, descriptive names without spaces or special characters to facilitate easy recognition and reduce potential errors during import.
Should I include charts and graphs from Excel in Tableau?
+
Tableau has its own robust set of visualization tools, so it’s better to use Tableau’s features for creating charts and graphs rather than importing them from Excel.
