5 Easy Steps to Insert Charts on New Sheets in Excel

If you work with data in Microsoft Excel, one of the most effective ways to present your findings is through charts. Charts help visualize complex data in a manner that is easily understood by all stakeholders, making your analysis both accessible and impactful. However, managing multiple charts within the same worksheet can clutter your workspace. Here’s where the feature to insert charts on new sheets comes in handy. In this guide, we'll walk through how to efficiently create charts on separate sheets using Microsoft Excel.
Step 1: Preparing Your Data

Before you can insert a chart, you need to have your data ready:
- Clean Your Data: Ensure your dataset is clean, with headers, and free from any blank rows or columns that could disrupt chart creation.
- Organize: Organize your data in a tabular format where each column represents a variable or a category.
- Select: Decide which part of your data you want to visualize.
📊 Note: Ensure you have at least two data series for Excel to generate a meaningful chart.
Step 2: Inserting a Chart on a New Sheet

To start, follow these steps:
- Select the data range you wish to chart.
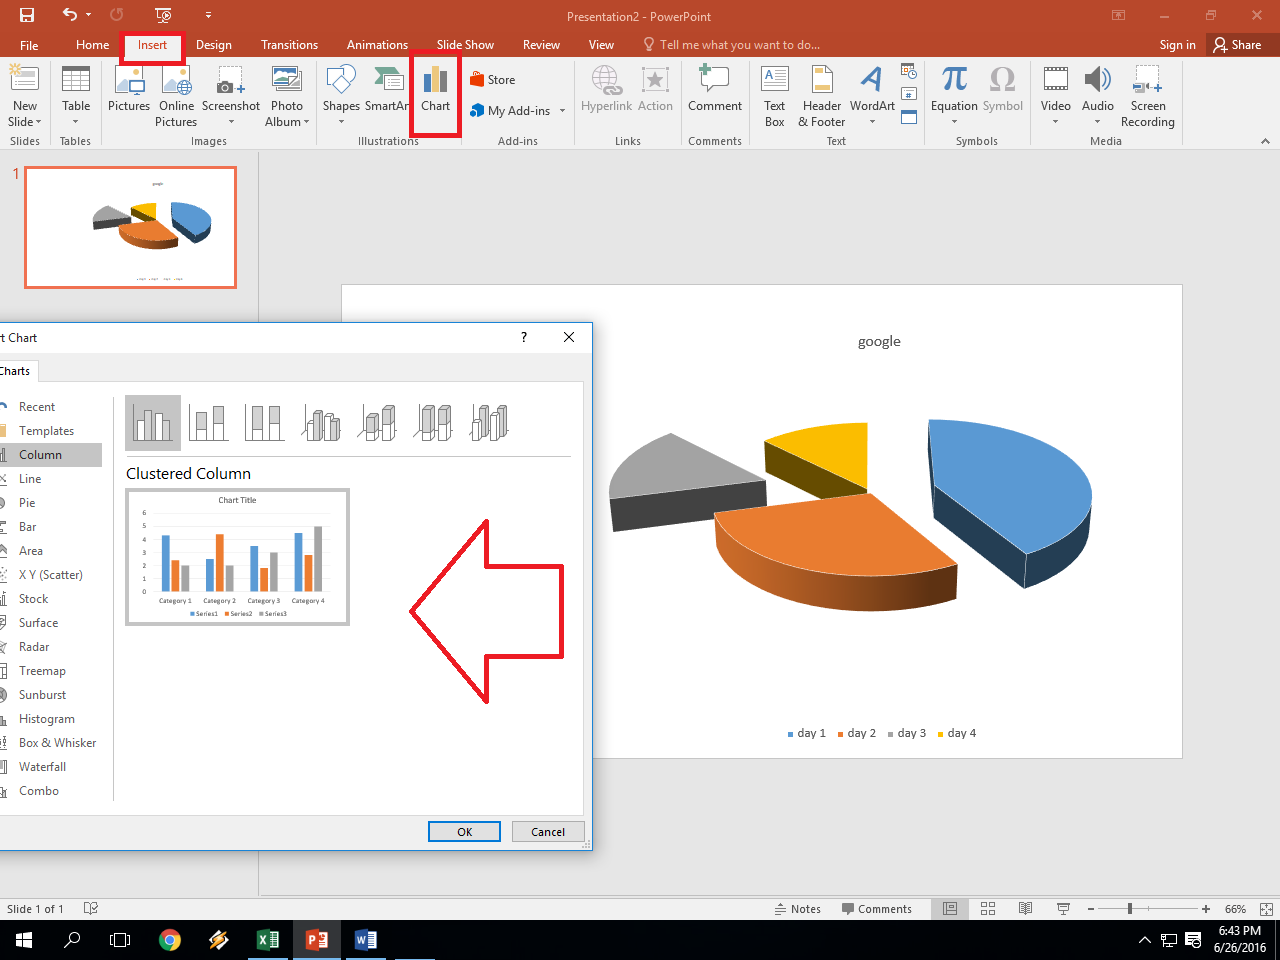
- Go to the Insert tab on the Excel ribbon.
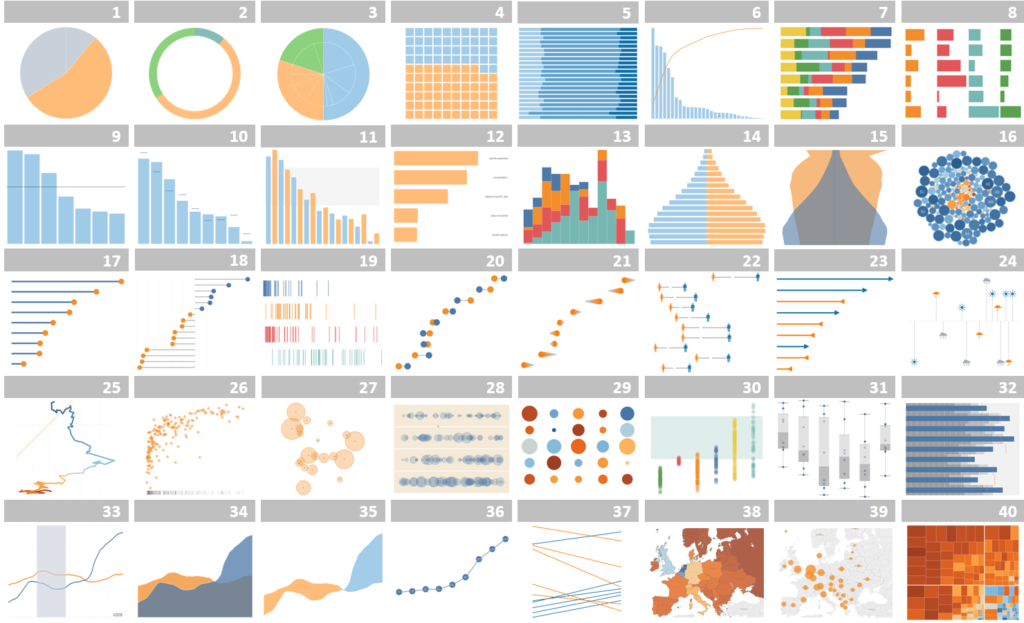
- Click on the desired chart type under the "Charts" section. For example, click on "Column," "Line," or "Pie."
- Choose the specific chart subtype if available.
- Once the chart is created in the current worksheet, right-click on it.
- From the context menu, select Move Chart.
- In the "Move Chart" dialog box, click on New Sheet and enter a name for the new chart sheet.
- Click OK.
Step 3: Customizing Your Chart

With your chart now on its own sheet, you can tweak it for presentation:
- Chart Title: Add a descriptive title to your chart.
- Labels and Legend: Include axis labels and a legend if necessary for clarity.
- Formatting: Adjust the chart's color scheme, fonts, and layout to match your reporting style or company branding.
- Data Labels: Add data labels to show exact values on the chart.
🎨 Note: Consistency in formatting across multiple charts aids in creating a professional presentation.
Step 4: Updating Charts Automatically

Dynamic charts automatically update when underlying data changes:
- Use Excel Tables: If your data is in a table, any chart linked to this table will update dynamically.
- Named Ranges: Define named ranges for your data sources, which make updating charts easier.
- Formulas: Ensure your chart uses formulas for data sources; changes in these formulas will reflect in the chart.
Step 5: Best Practices for Chart Management

To keep your workbook organized and your charts accessible:
- Consistent Naming: Name your chart sheets in a meaningful way.
- Chart Index: If you have numerous charts, consider creating an index sheet listing all chart sheets.
- Save As Template: Once you have a chart setup you like, save it as a template for future use.
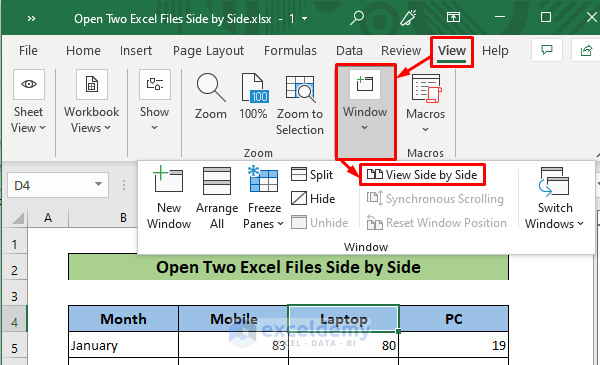
- Chart Sharing: When sharing your workbook, make sure all charts are visible and not obscured.
By following these steps, you can streamline your data presentation in Excel, ensuring your audience can easily interpret your data visualizations. Remember, charts on new sheets not only clean up your primary data sheets but also allow for detailed annotations and easier viewing of charts, making your analysis more presentable and professional.
Why should I insert charts on new sheets?

+
Inserting charts on new sheets keeps your data sheets uncluttered, making them easier to navigate and work with, while also providing a dedicated space for detailed chart annotations and formatting.
Can I update the chart data after moving it to a new sheet?

+
Absolutely, charts will update automatically when you change the underlying data if the data is properly linked to the chart.
How do I share my Excel workbook with multiple charts?

+
When sharing, ensure all chart sheets are visible by checking the “Show Sheet Tabs” option in Excel settings, and consider creating an index sheet to guide viewers through your workbook.


