Easily Add Excel Sheets to Google Slides - Quick Guide

In today's fast-paced world of presentations and data sharing, the ability to swiftly incorporate your Excel spreadsheets into Google Slides can dramatically enhance your presentations' effectiveness. Whether you're a business analyst presenting quarterly results, a teacher explaining complex datasets, or anyone in between, integrating spreadsheets into your slides can streamline your work process and impress your audience. This guide will walk you through how to add Excel sheets to Google Slides effortlessly.
Why Use Google Slides?

Google Slides is a part of Google Workspace, offering:
- Collaboration: Multiple users can edit presentations simultaneously.
- Accessibility: Available on any device with an internet connection.
- Integration: Seamless integration with other Google products like Google Sheets.
- Real-time Updates: Changes in linked Google Sheets update automatically in your presentation.
Steps to Add Excel Sheets to Google Slides

Here's how you can incorporate your Excel data into your Google Slides:
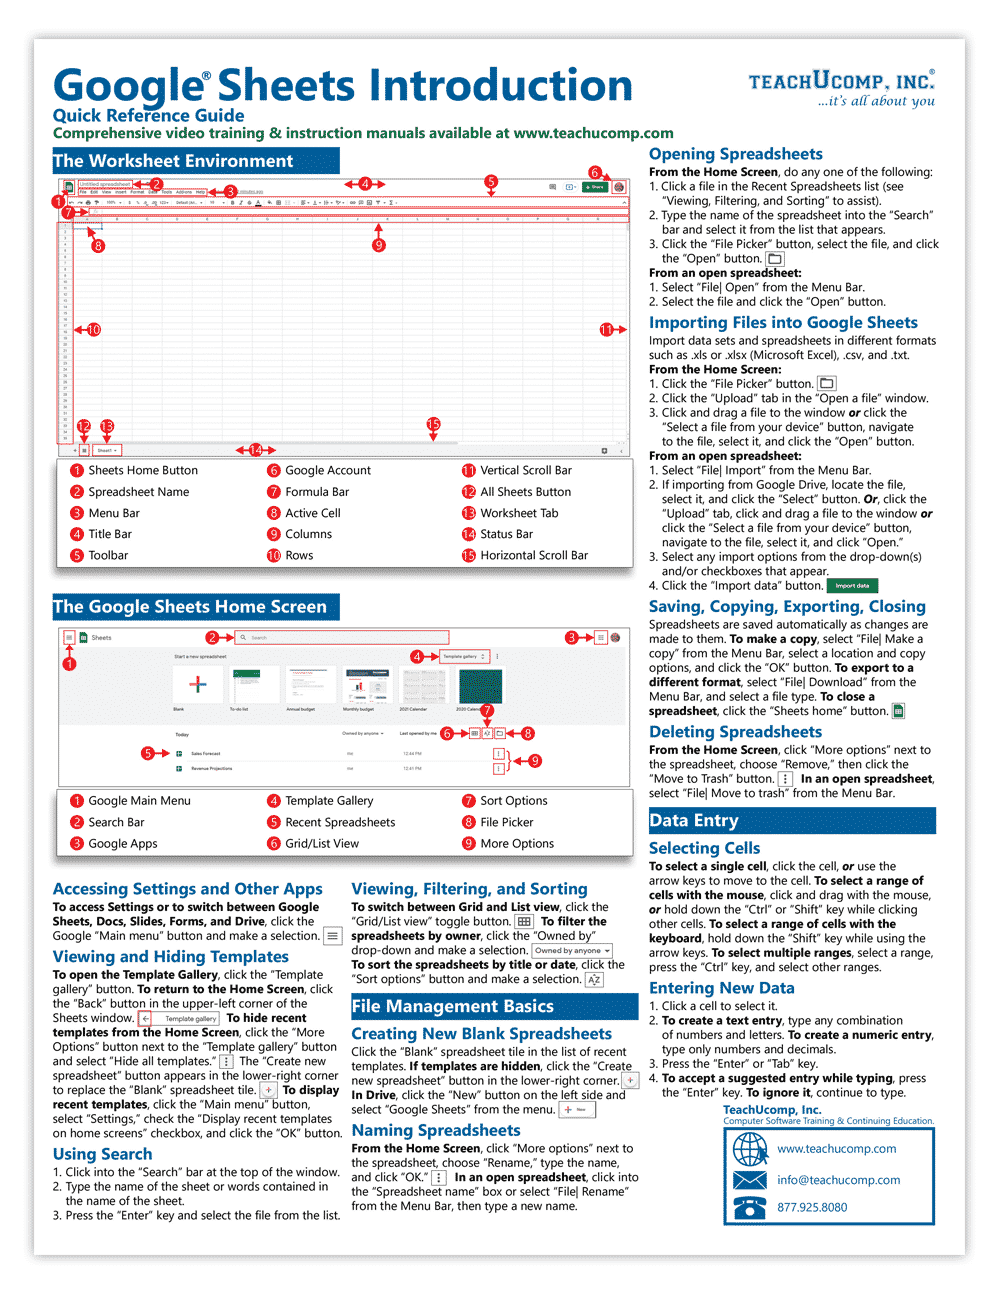
Convert Your Excel File to Google Sheets

- Open Google Drive.
- Click on New and select File Upload.
- Choose your Excel (.xlsx, .xls) file from your computer.
- Once uploaded, double-click the file to open it. Google Drive will convert it to a Google Sheets format.
Link Your Google Sheet to Google Slides

- Open your presentation in Google Slides.
- Go to Insert > Chart > From Sheets.
- Select the sheet you converted and choose the chart you want to insert.
📌 Note: If your Excel file contains multiple sheets, ensure you're selecting the correct one.
Insert the Chart into Your Slide

- After selecting the chart, click Import to add it to your slide.
- You can then adjust the size and position of the chart.
📌 Note: Any updates made to the chart in Google Sheets will automatically reflect in Google Slides if you choose to link the data.
Options for Data Integration

- Link to Spreadsheet: Your chart in Google Slides will update with any changes made in the Google Sheet.
- Paste Unlinked: Provides a static image of the chart, which won’t update with changes in the spreadsheet.
📌 Note: Linking requires an active internet connection for real-time updates.
Tips for Effective Data Presentation

Here are some tips to make your data presentation visually appealing and easy to understand:
- Keep it Simple: Avoid overloading your slides with data. Focus on key metrics or trends.
- Use Visuals: Incorporate charts and graphs to visualize data, making it easier to digest.
- Customize: Use colors, fonts, and themes consistent with your overall presentation.
Now you've mastered the art of adding Excel data to Google Slides, you can enhance your presentations with dynamic data, saving time and ensuring your slides are always up-to-date. Integrating spreadsheets into slides allows for a more fluid presentation experience, reducing the need for last-minute changes and ensuring your data is visually impactful.
How do I update a linked chart in Google Slides?

+
If the chart is linked to a Google Sheet, any changes you make in the sheet will automatically update in Google Slides. You need to have an internet connection for this feature to work.
Can I edit the chart in Google Slides?

+
While you can adjust the chart’s size and position, detailed editing must be done within the linked Google Sheets file.
What happens if I lose internet connection during my presentation?

+
Without an internet connection, linked charts won’t update, but the static version of the chart will remain visible. Consider downloading the presentation with offline access enabled in Google Drive to prevent this issue.


