5 Ways to Group Data in Excel Sheets

In today's data-driven world, effective organization is key. Whether you're dealing with financial records, project management, or any other information, grouping data in Microsoft Excel can significantly streamline your analysis process. This post will explore 5 Excel grouping techniques to help you manage your data with greater efficiency.
1. Grouping by Columns

Grouping columns in Excel can make it easier to collapse and expand sections for better viewing, especially when dealing with wide datasets:
- Select the columns you want to group.
- Right-click and choose ‘Group’ from the context menu.
- Or go to the ‘Data’ tab, find ‘Outline’ group, and click ‘Group’.
Your screen now displays little icons allowing you to show or hide grouped columns.
🔖 Note: Remember, grouping columns in Excel does not change the underlying data; it just organizes the view for easier navigation.

2. Grouping by Rows
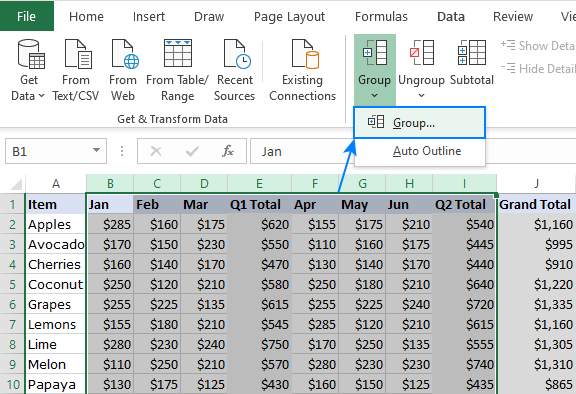
Grouping rows is very similar to grouping columns but focuses on vertical data segments:
- Select the rows for grouping.
- Use the right-click menu or ‘Data’ tab to ‘Group’.
- You’ll see outline symbols to expand/collapse the grouped rows.
📘 Note: This method is ideal for detailed breakdowns, like categorizing sales by different regions or time periods.
3. Nested Grouping

Sometimes, data needs to be grouped into multiple levels for hierarchical analysis:
- Start by grouping larger categories.
- Within those groups, select and group subcategories.
- Excel will create layers of expandable and collapsible sections.
Nested grouping is perfect for reports that require different levels of granularity.
4. Grouping with Pivot Tables

Pivot Tables are powerful tools for data grouping and summarization:
- Select your data and insert a Pivot Table.
- Drag fields into the ‘Row Labels’ or ‘Column Labels’ to group by them.
- Expand and collapse to analyze grouped data interactively.
Here’s an example of a pivot table summarizing sales by product category:
| Category | Total Sales |
|---|---|
| Electronics | 10,000 |
| Clothing | 5,000 |

Pivot Tables allow for dynamic grouping and complex data analysis.
5. Advanced Grouping with VBA

For more complex grouping requirements, consider using VBA:
- Open the VBA editor (Alt + F11).
- Insert a new module.
- Write a macro to automate grouping based on your custom logic.
This approach offers greater flexibility and control:
Sub GroupByColumn()
    ‘Group the selected columns
    Dim ws As Worksheet
    Set ws = ActiveSheet
    ws.Range(“B:B,D:D,F:F”).Columns.Group
End Sub
🚀 Note: VBA requires some coding knowledge, but it's incredibly powerful for Excel power users.
To summarize, we’ve explored five methods for grouping data in Excel:
- Column grouping for organizing wide datasets.
- Row grouping for vertical analysis.
- Nested grouping for hierarchical data structures.
- Pivot Tables for dynamic data summary and grouping.
- VBA for custom grouping solutions.
Each technique has its place depending on the nature of your data and analysis needs. By incorporating these techniques, you can work more efficiently and extract meaningful insights from your datasets, enhancing both productivity and the quality of your analysis.
Can I group data from multiple sheets simultaneously in Excel?
+
No, grouping must be done on a per-sheet basis. However, you can consolidate data from multiple sheets into one sheet using tools like Consolidation or Power Query before grouping.
How do I remove grouping in Excel?

+
To ungroup, either right-click on the grouped section and choose ‘Ungroup’ or use the ‘Data’ tab and click ‘Ungroup’ within the ‘Outline’ group.
Can I change the behavior of how groups expand or collapse?
+
Yes, you can control the default behavior in the ‘Group’ settings, allowing groups to auto-collapse or expand differently.


