How to Manage Large Excel Sheets Effectively

Managing large Excel sheets can be a daunting task for many, whether you're tracking inventory, analyzing financial data, or organizing event logistics. However, with the right strategies and tools, you can transform a cumbersome spreadsheet into a powerful data management system. Here's how to make your Excel experience more efficient and less overwhelming.
Organizing Data with Named Ranges


One of the first steps in managing large Excel sheets is to organize data into manageable segments. Using named ranges in Excel allows you to:
- Define specific areas of your worksheet for quick reference.
- Improve readability by giving meaningful names to data blocks.
- Facilitate formula writing by using names instead of cell references.
To create a named range:
- Select the cells you want to name.
- Go to the ‘Formulas’ tab, click ‘Define Name’.
- Enter a name in the ‘Name’ field and click ‘OK’.
💡 Note: Ensure that your named ranges do not conflict with existing Excel functions or names to avoid errors.
Mastering Excel Shortcuts for Speed


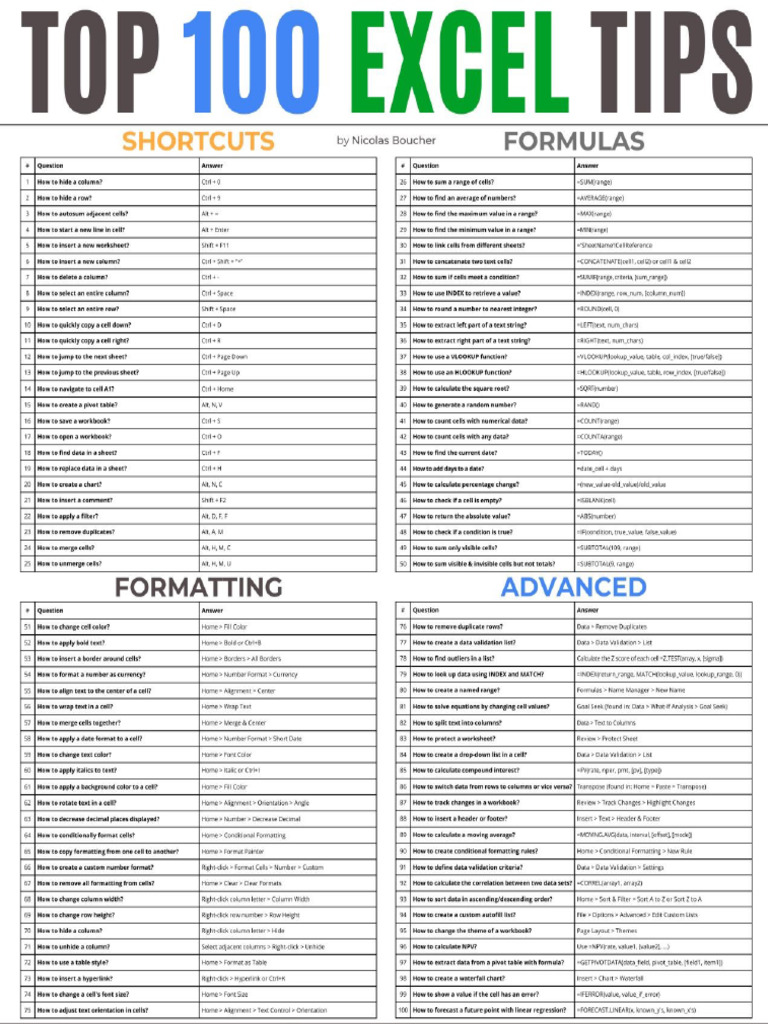
Here are some essential Excel shortcuts that can significantly speed up your workflow:
- Ctrl + Arrow Key: Jump to the edge of data region.
- Alt + D, L: Open the Data Validation dialog box.
- Alt + E, S, V: Paste Values only.
- Shift + Space: Select an entire row.
- Ctrl + Space: Select an entire column.
By mastering these shortcuts, you can navigate and manipulate large Excel datasets with ease.
Data Filtering and Sorting


Excel’s filtering and sorting capabilities help in managing large datasets by:
- Quickly isolating relevant information.
- Organizing data in a structured manner.
- Reducing the visible data to focus on specific sets.
Here’s how you can sort and filter your data:
- Select your data range or table.
- Go to the ‘Data’ tab and click ‘Sort’ or ‘Filter’.
- Set your sorting parameters or apply filters as needed.
📝 Note: When filtering, always ensure your entire data range is selected to avoid missing out on any rows or columns.
Utilizing PivotTables for Analysis


PivotTables are one of Excel’s most powerful features for data analysis:
- Summarize Data: Quickly sum, average, or count large datasets.
- Interactive Reports: Users can dynamically change the view of data without altering the dataset.
- Spot Trends: Identify patterns or issues with ease.
Creating a PivotTable involves:
- Selecting your data range or table.
- Navigating to ‘Insert’ > ‘PivotTable’.
- Choosing the placement of the PivotTable and selecting the data fields you want to analyze.
Using Conditional Formatting


Conditional formatting allows you to visually highlight important data points, making large datasets more intuitive:
- Highlight Duplicates: Easily spot repetitions or errors in your data.
- Data Bars: Visualize data distribution across rows or columns.
- Color Scales: Use color gradients to show data variability.
To apply conditional formatting:
- Select the data range you wish to format.
- Go to ‘Home’ > ‘Conditional Formatting’ > Select your format rule.
- Customize the rule as per your requirements.
Performance Tips for Large Excel Files


When dealing with large Excel sheets, performance becomes crucial. Here are some strategies to keep your workbook running smoothly:
- Minimize Volatile Functions: Functions like NOW() or INDIRECT() can slow down recalculation.
- Use Table Data: Excel tables are optimized for better performance.
- Limit External Links: Reduce or eliminate external data connections.
- Control Recalculation: Use manual recalculation by pressing F9 only when needed.
⚠️ Note: Overuse of complex formulas can significantly degrade performance; simplify where possible.
Collaboration and Data Sharing


With the rise of remote work, Excel’s features for sharing and collaboration are invaluable:
- Co-Authoring: Multiple users can edit the same sheet simultaneously.
- Comments: Add comments to cells for clarifications or feedback.
- Version Control: Keep track of changes with version history.
Enabling these features:
- Save your workbook to OneDrive, Google Drive, or SharePoint.
- Share the document via email or a link.
- Collaborators can now edit, add comments, and view changes in real-time.
Advanced Formulas and Functions


For dealing with complex data analysis, advanced Excel functions can be your allies:
- INDEX-MATCH: A more flexible alternative to VLOOKUP.
- XLOOKUP: Replaces VLOOKUP with the ability to look up data in any direction.
- Power Query: For data transformation and cleaning from various sources.
Learning these functions will:
- Enhance your ability to analyze and manipulate data.
- Provide more precise control over large datasets.
- Reduce errors and increase the accuracy of your reports.
By implementing these strategies, you can not only manage but also extract maximum value from your large Excel sheets. The key is to balance efficiency with accuracy, using Excel's vast array of tools to streamline your data tasks, collaborate effectively, and make informed decisions based on robust data analysis.
How can I quickly find a specific piece of data in a large Excel sheet?

+
You can use the “Find” function by pressing Ctrl+F or using the ‘Find & Select’ option under the ‘Home’ tab. This feature allows you to search for specific text, numbers, or formulas throughout your spreadsheet.
What can I do to speed up Excel when working with large files?

+
To speed up Excel with large files, minimize the use of volatile functions, use manual calculation mode, convert data into tables, and ensure your workbook does not contain unnecessary or excessive external links.
Is there a way to work collaboratively on an Excel file with others?

+
Yes, by saving your Excel file to OneDrive, Google Drive, or SharePoint, you can share the document with others. Excel’s co-authoring feature allows multiple users to edit the same document in real-time.


