Master Excel: Draw Pivot Tables Easily

In the fast-paced business environment of today, proficiency in tools like Excel has become almost a requirement rather than an advantage. Among the suite of features in Excel, pivot tables stand out as an incredibly powerful tool for summarizing, analyzing, exploring, and presenting your data. Whether you're a seasoned Excel user or a novice looking to up your spreadsheet game, mastering the art of creating pivot tables can significantly boost your productivity and decision-making capabilities.
Understanding Pivot Tables

A pivot table is essentially a data processing tool that lets you summarize large datasets by reordering and rearranging (or “pivoting”) the data. Here’s how you can easily start drawing pivot tables:
Step 1: Prepare Your Data

- Ensure your data is clean and formatted in a tabular structure, with no blank rows or columns.
- Each column should have a header.
- Your data should be in one continuous range without merging or splitting cells.
💡 Note: If your data spans multiple sheets or external sources, consider using Power Query to consolidate and prepare your data.
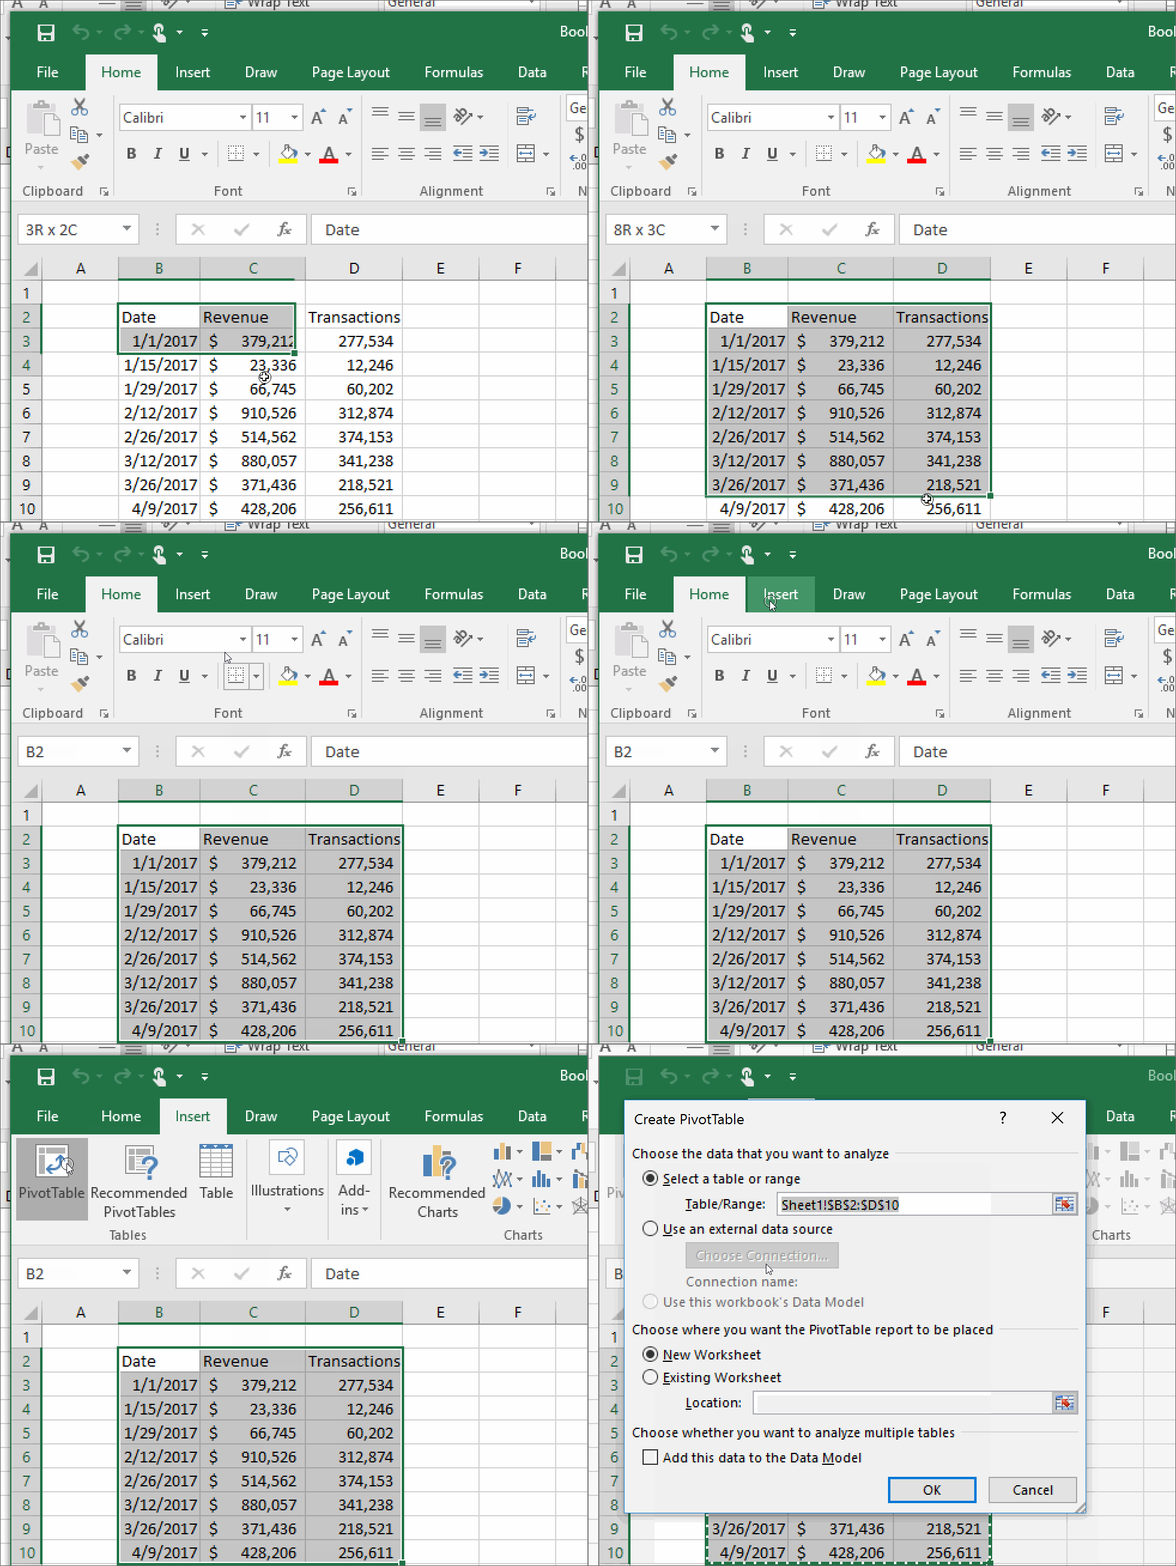
Step 2: Select Your Data

To create a pivot table, select any cell within your data range, or if your data is in an Excel Table, click anywhere inside the table.
Step 3: Insert the Pivot Table

- Go to the ‘Insert’ tab on the Ribbon.
- Click on ‘PivotTable’. A dialog box will appear.
| Option | Description |
|---|---|
| Select a Table or Range | If your data is already selected, Excel will auto-fill this field. |
| Choose Where to Place Your Pivot Table | Choose between a new worksheet or an existing one. |
- After making your selections, click ‘OK’.
Step 4: Build Your Pivot Table
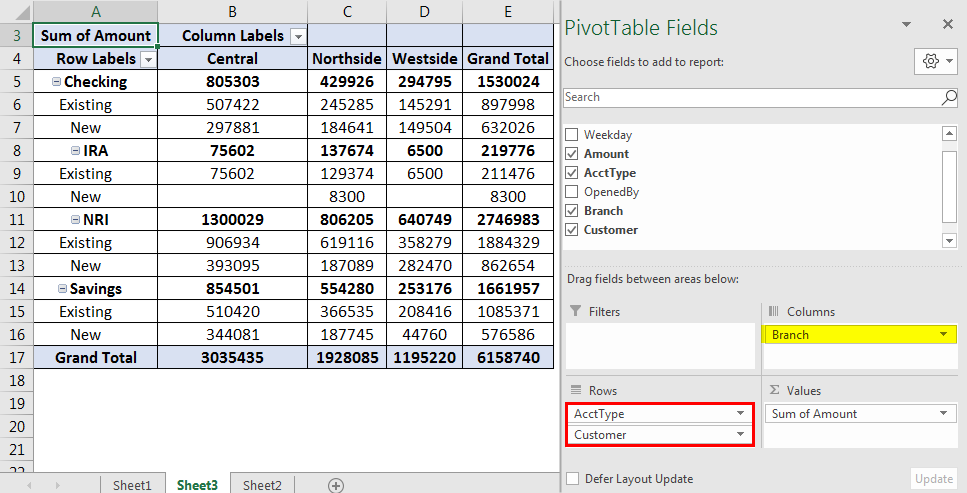
- The ‘PivotTable Fields’ pane will appear on the right side of the screen.
- Drag fields into one of the four areas: Report Filter, Column Labels, Row Labels, and Values.
Example: Let's say you have sales data:
- Drag the 'Region' field into Row Labels to see data by region.
- Drag 'Product' into Column Labels to break down sales by product.
- Drag 'Sales Amount' into Values to sum the sales.
Customizing Your Pivot Table

Once your basic pivot table is set up, you can:
- Sort and Filter: Click on the drop-down arrows to sort or filter data based on criteria.
- Group Data: Group date fields by day, month, year, or any custom range.
- Calculated Fields: Add custom calculations to your pivot table.
- Conditional Formatting: Highlight key data with color scales, data bars, or icons.
Step 5: Refresh and Update Data

After setting up your pivot table, if your source data changes, simply right-click anywhere in the pivot table and select 'Refresh' to update the pivot table with the latest data.
Advanced Pivot Table Techniques

Here are some advanced techniques to take your pivot tables to the next level:
- Slicer: Use slicers for intuitive filtering.
- Timeline: For date fields, a timeline slicer can allow users to select data by time periods easily.
- Show Values As: Use this to calculate differences, percent of total, running totals, and more.
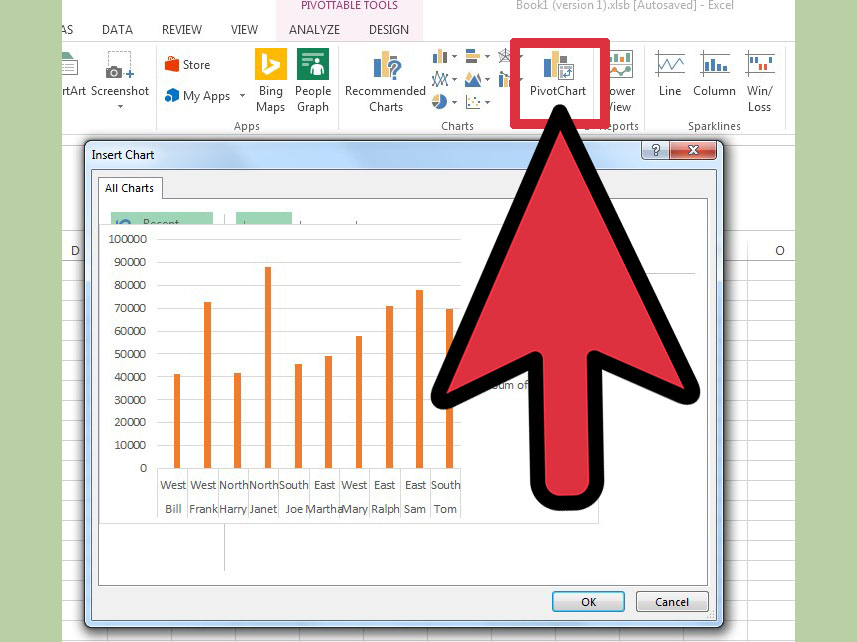
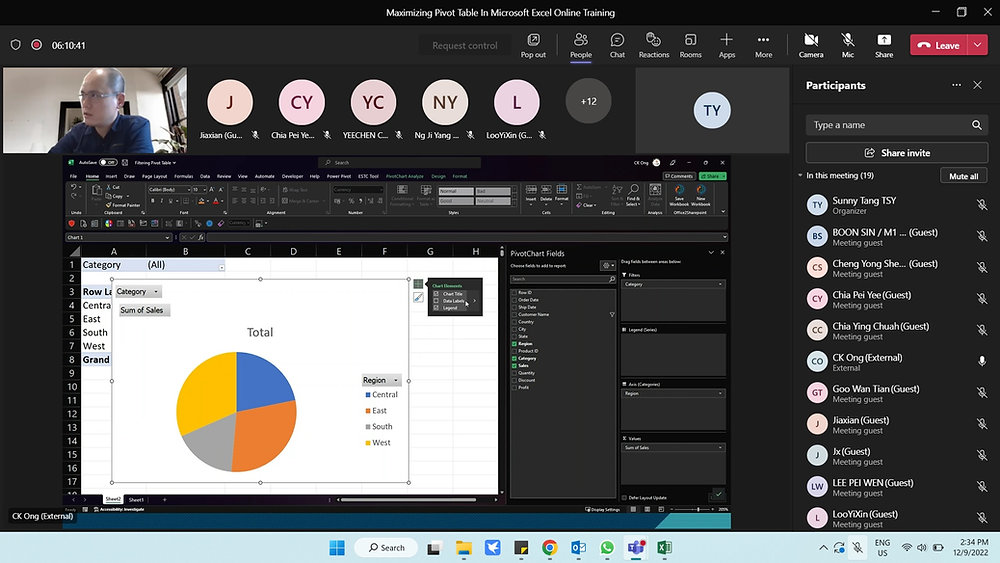
- Pivot Charts: Visualize your pivot table data with charts.
⚠️ Note: Ensure your Excel version supports advanced features like slicers and timelines.
In conclusion, mastering pivot tables in Excel is not just about mastering a tool; it's about transforming how you interact with data. Pivot tables help you dive into data analysis, uncover trends, make comparisons, and ultimately, drive better business decisions. With a bit of practice, the seemingly complex world of pivot tables becomes an intuitive and indispensable part of your data analysis toolkit.
What are pivot tables used for?
+
Pivot tables are used for summarizing, sorting, reorganizing, grouping, counting, totaling, or averaging data stored in a spreadsheet. They allow users to extract meaningful insights from large datasets.
Can pivot tables automatically update?

+
Yes, by refreshing the pivot table, it will update with any changes made to the source data. However, this does not happen automatically; you need to manually refresh or set Excel to refresh upon opening the file.
How can I use pivot tables for complex data analysis?
+
Pivot tables can be used for complex analysis through calculated fields, custom sorting, grouping data, and using ‘Show Values As’ to compare data in different ways like percentage difference or running totals.
