Excel 2013 Sheet Design Tips for Beginners

Excel 2013 has been a vital tool for many organizations and individuals for data analysis, record keeping, and more. Whether you're crafting financial reports, organizing your budget, or managing complex project timelines, knowing how to effectively design and manipulate spreadsheets can save you time and enhance your productivity. This comprehensive guide dives into various tips and tricks specifically for those just starting out with Excel 2013. Let’s embark on this journey to turn you from a novice into an Excel sheet design pro!
Getting Started with Basic Layout

Before diving into the deep functionalities, let’s cover the basics of sheet design:
- Gridlines and Borders: By default, Excel shows gridlines to help structure your data visually. To toggle gridlines, navigate to View > Show > Gridlines. For borders, select your range and click the Borders button on the Home tab.
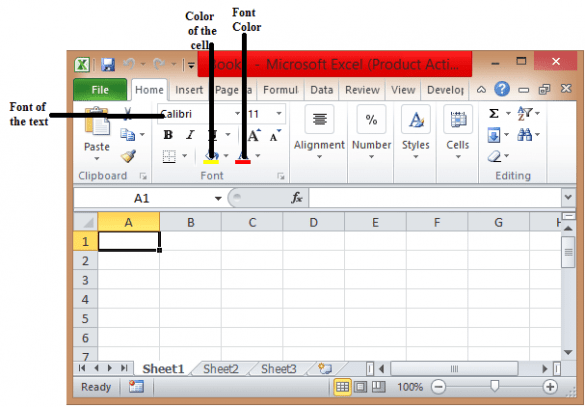
- Font and Formatting: Uniformity is key. Set your fonts, sizes, and colors to ensure your spreadsheet is not only legible but also visually appealing. Use Font, Alignment, and Number groups on the Home tab.
- Headers and Footers: Clearly define your column headers for readability. Use Insert > Header & Footer for adding fixed headers or footers to every page of your printed document.

Mastering Data Entry

Data entry is not just about typing in numbers; it’s about setting up your data correctly:
- Data Validation: Prevent incorrect entries with data validation. Go to Data > Data Validation and set rules for cell contents.
- AutoFill and Flash Fill: Use AutoFill to quickly complete series or copy formulas. Flash Fill, a new feature in Excel 2013, can recognize patterns in your data and fill adjacent cells accordingly.
- Custom Lists: Create your lists for recurring data entries, which can speed up your work significantly.
Enhancing Data Organization

Organizing your data effectively can transform a chaotic spreadsheet into a model of clarity:
- Sorting and Filtering: Enable easy data management by sorting or filtering data. Use the Sort & Filter button on the Home tab to customize how your data is displayed.
- Group and Outline: For complex spreadsheets, group related rows or columns for better navigation. Navigate to Data > Group > Auto Outline.
| Feature | How to Access | Use Case |
|---|---|---|
| Sort | Home > Sort & Filter | Sort data by one or multiple columns |
| Filter | Home > Sort & Filter | Display specific records based on criteria |
| Group | Data > Group | Organize related data for easy expansion/collapse |

Formulas and Functions for Beginners

Mastering basic formulas is essential:
- Basic Arithmetic: Start with simple operations like SUM, AVERAGE, COUNT, and more. They’re accessible via Formulas > AutoSum or by typing them directly into cells.
- Functions: Explore functions like IF, VLOOKUP, INDEX/MATCH, which provide more dynamic control over your data analysis.
🔖 Note: Don't forget to use the formula bar to edit, debug, or see the content of a formula in a cell.
Visualizing Data with Charts and Graphs

Visual representation of data can convey messages more effectively:
- Creating a Chart: Select your data and go to Insert > Charts to choose from various chart types like column, line, pie, etc.
- Customizing Charts: Modify chart elements like titles, labels, and legend positions to make your data stand out. Use Chart Tools for customization options.
Conditional Formatting for Insightful Design

Highlight data points with conditional formatting:
- Data Bars: Add color bars within cells to compare values visually.
- Color Scales: Use color gradients to indicate values relative to each other.
- Icon Sets: Insert icons for quick visual references.
Efficiency with Shortcuts

Speed up your work with these Excel shortcuts:
- Ctrl + C - Copy
- Ctrl + V - Paste
- Ctrl + Z - Undo
- Ctrl + Y - Redo
- F2 - Edit selected cell
- Alt + E, S, V - Paste special
In conclusion, mastering the art of Excel sheet design requires patience and practice. From setting up your layout, organizing data, using formulas, and visualizing with charts to customizing with conditional formatting, these tips are your stepping stones. Efficiency through shortcuts can further elevate your productivity. Remember, Excel is a powerful tool, and your journey to becoming proficient in it is as much about understanding its features as it is about crafting an intuitive and insightful spreadsheet.
How do I protect my Excel sheet from accidental changes?

+
Use the Protect Sheet feature under the Review tab. Here, you can choose what users can or cannot do, from editing to formatting.
Can I change the color of specific cells based on their value?

+
Yes, with conditional formatting. Navigate to Home > Conditional Formatting, then choose rules or formulas to apply colors dynamically.
How can I make my Excel sheet look professional?

+
Apply consistent formatting, use tables for structured data, leverage cell styles, and consider adding a header and footer for a polished look.


