Mastering Pivot Tables in Excel: A Step-by-Step Guide

Excel's Pivot Tables are powerful tools that allow users to summarize, analyze, explore, and present their data. Whether you're a data analyst, financial expert, or just someone who loves to organize information, mastering pivot tables can significantly enhance your productivity and data interpretation skills. In this comprehensive guide, we will dive deep into how you can leverage pivot tables to transform vast datasets into meaningful insights.
Why Use Pivot Tables?

- Ease of Data Analysis: Pivot tables allow you to quickly summarize large datasets without writing complex formulas or code.
- Flexibility: You can easily modify views to answer different questions from the same data.
- Dynamic Reports: They facilitate the creation of interactive reports that can be updated with new data automatically.
- Comparative Analysis: Pivot tables are excellent for comparing different segments of data side by side.
Getting Started with Pivot Tables

Here’s a step-by-step guide to creating your first pivot table:
Step 1: Prepare Your Data

- Ensure your data is in an Excel table or range format. This means your dataset should have headers in the first row, no blank rows or columns, and consistent formatting.
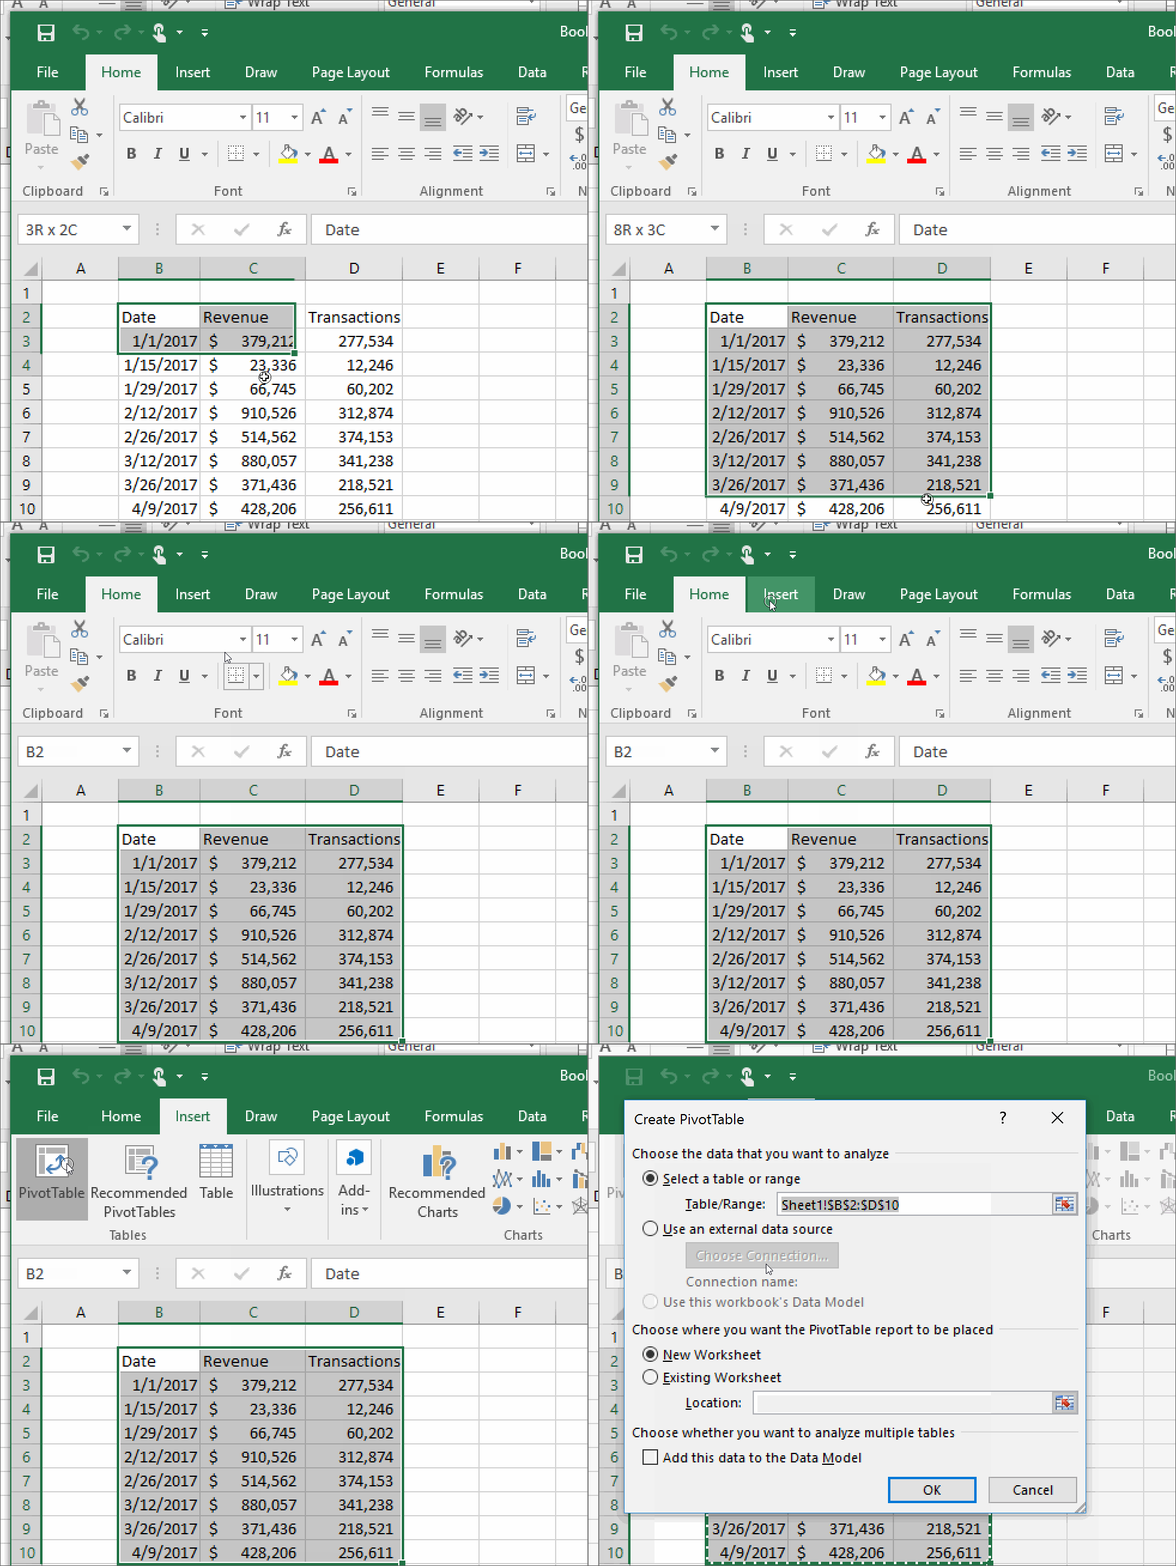
- Here’s a simple example of how your data might look:
| Name | Sales | Region |
|---|---|---|
| John Doe | 2000</td><td>North</td></tr> <tr><td>Jane Smith</td><td>3500 | South |
| Tom Brown | $2800 | East |

Step 2: Insert a Pivot Table

- Navigate to the Insert tab and click on PivotTable. A dialog box will appear:
- Select the range or table containing your data.
- Choose where you want the Pivot Table to be placed - either on the same worksheet or a new one.
Step 3: Build Your Pivot Table

- Drag fields into the different areas:
- Row Labels - for categories to group by.
- Column Labels - for additional grouping or comparison.
- Values - to aggregate data, like sum, average, count, etc.
- Filters - to filter the entire pivot table.
- Let’s say we want to analyze sales by region:
- Drag Region to Row Labels.
- Drag Sales to Values and change it to show ‘Sum of Sales’.
Step 4: Customize Your Pivot Table

- You can change how data is displayed by:
- Changing the value field settings (sum, count, average).
- Formatting numbers (currency, percentage, etc.).
- Adding subtotals and grand totals.
- Using calculated fields for more complex analysis.
Step 5: Update and Refresh

- If your source data changes, refresh your pivot table:
- Right-click inside the PivotTable, and select “Refresh”.
- For automatic updates, you can set up a data connection or use the ‘Analyze’ tab and choose ‘Options’ to refresh data when opening the file.
Advanced Pivot Table Techniques

Using Slicers for Interactive Filtering

- Slicers provide a user-friendly way to filter pivot table data interactively. You can add slicers by:
- Go to the PivotTable Tools > Analyze > Insert Slicer.
- Select the fields you want to filter with slicers.
Creating PivotCharts

- PivotCharts visually represent pivot table data:
- Click on your pivot table, then go to PivotChart in the Insert Tab.
- Choose the chart type that best represents your data.
Summing Up

The pivot table is an invaluable tool in Excel for anyone dealing with data analysis. By following the steps and techniques outlined above, you can leverage pivot tables to transform complex datasets into actionable insights. Remember, practice makes perfect; the more you work with pivot tables, the more intuitive they become. With the ability to analyze, summarize, and interact with your data dynamically, your decision-making process will be significantly enhanced.
Can I use Pivot Tables with data from multiple sheets?

+
Yes, you can use data from multiple sheets to create a pivot table. This is done by creating a consolidation range or using the “Multiple Consolidation Ranges” option when inserting the pivot table. This method combines data into one pivot table for analysis.
What are some common issues when working with Pivot Tables?

+
Common issues include:
- Blank rows or columns in the dataset: Ensure there are no empty rows or columns within your data range.
- Non-consistent data types: Inconsistent data types or formats in columns can cause errors.
- Grouped data: If you need to analyze grouped data, ensure that all data is grouped correctly before creating the pivot table.
Can I change data source in a Pivot Table after it has been created?

+
Absolutely. To change the data source:
- Right-click on the pivot table and select Change Data Source.
- Select the new range or table from which you want to extract data.


