Creating Graphs from Multiple Excel Sheets Easily

When working with data, one of the most effective ways to visualize and communicate your insights is through graphs and charts. However, if your data is spread across multiple Excel sheets, the process of creating these graphs can seem daunting. This comprehensive guide will walk you through the steps to create graphs from multiple Excel sheets, making the process straightforward, efficient, and less time-consuming.
Why Use Multiple Sheets?

Before we dive into how to consolidate data and create graphs, it’s useful to understand why you might want to use multiple sheets:
- Organization: Multiple sheets can keep data for different months, quarters, or categories neatly separated.
- Data Management: Easier to manage and maintain large datasets, reducing clutter in a single sheet.
- Tracking Changes: It can be useful to have separate sheets for different versions of data or time periods to track changes over time.
Preparation of Data

To create a graph from data in multiple sheets, preparation is key. Here’s how to prepare your data:
Step 1: Organize Your Data

Ensure that your data across different sheets follows a similar structure:
- Consistent column headings across sheets.
- Check for blank rows or columns and remove them.
- Ensure data types are consistent for aggregation or comparison.
Step 2: Consolidate Your Data

You can consolidate data manually or use Excel’s built-in tools:
Manual Consolidation
This method involves:
- Copying and pasting relevant data into one sheet.
- Aligning data from different sheets into a consistent layout.
⚠️ Note: Manual consolidation can be time-consuming and prone to errors, especially with large datasets.
Using Excel’s Tools
Excel offers two primary tools for data consolidation:
Using Consolidate Tool

- Select the cell where you want the consolidated data to appear.
- Go to Data > Consolidate.
- In the ‘Consolidate’ dialog:
- Choose ‘Sum’ as the function (or ‘Average’, ‘Count’, etc., based on your need).
- Add ranges from different sheets, ensuring the range references are correct.
- Check ‘Left Column’ or ‘Top Row’ if your data has labels.
- Click ‘OK’ to consolidate.
Using 3D Formulas

This method aggregates data across sheets with 3D references:
- Write your formula using the 3D reference format, e.g.,
=SUM(Sheet1:Sheet3!A1), where ‘Sheet1’ and ‘Sheet3’ are the start and end sheets, and A1 is the cell to aggregate. - Press Enter to calculate the sum across those sheets.
Creating Graphs

After consolidating your data, you can now create a graph:
Step 3: Insert a Chart

- Select your consolidated data range.
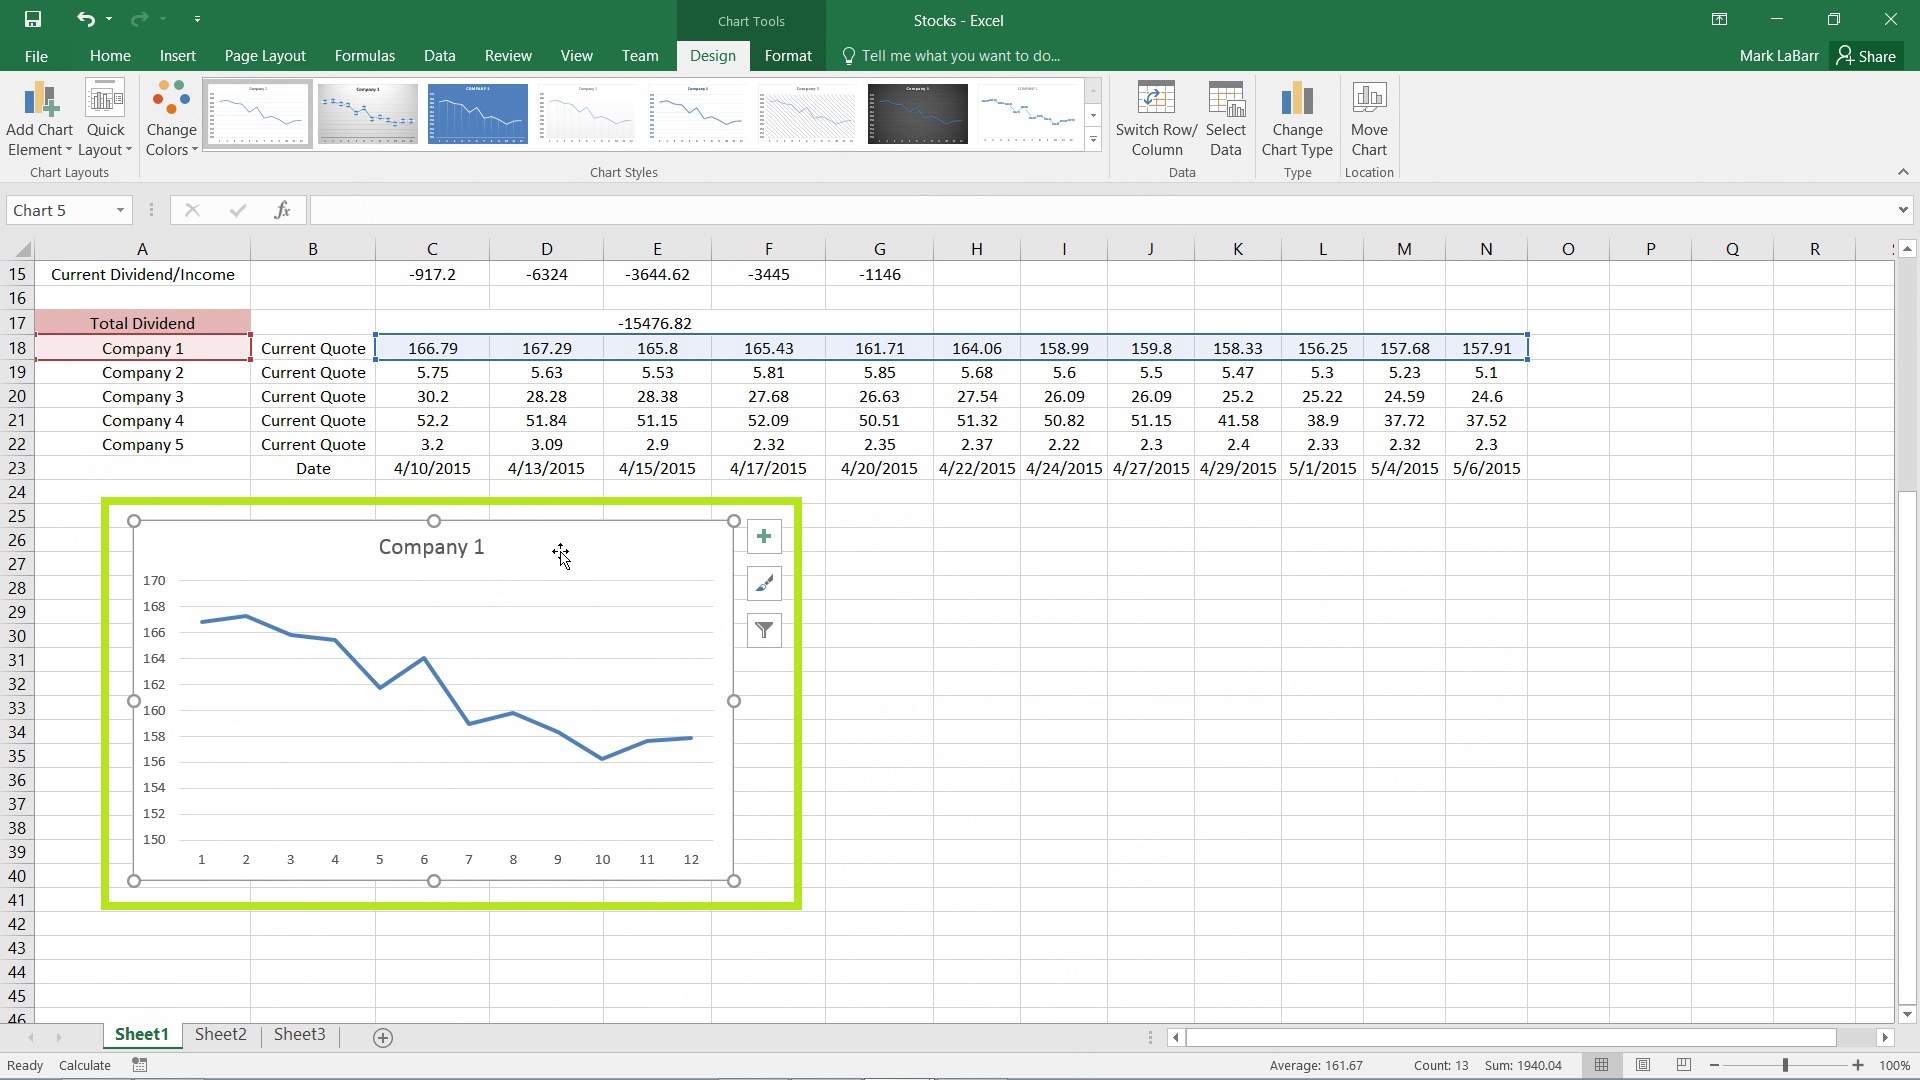
- Go to Insert > Chart and choose the graph type suitable for your data.
Excel will now generate a graph based on your selected data:
Step 4: Customize Your Graph

- Change chart styles or colors.
- Add titles, legends, and data labels for clarity.
- Adjust the axis labels to reflect what your data represents.
- Use the ‘Select Data’ option to modify what series are plotted.
Troubleshooting Common Issues

Here are some common issues you might encounter when working with graphs from multiple sheets:
- Data Not Appearing: Verify that your data ranges are correctly specified in the chart data source.
- Incorrect Data Calculation: Ensure your formulas are correctly aggregating data from different sheets.
- Formatting Errors: Adjust chart formatting to ensure it's readable and visually appealing.
Final Thoughts

This guide has provided you with the steps to effectively create graphs from data across multiple Excel sheets. By organizing your data, using Excel’s tools for consolidation, and creating graphs with accuracy and customization, you can elevate your data analysis and presentation. Remember to keep your data structured for easy graph creation, and with practice, these techniques will become part of your data analysis toolkit. Efficient data visualization is not just about showing numbers; it’s about telling a compelling story with your data.
How can I ensure all data from different sheets is accurate?

+
Double-check your formulas and references. Use Excel’s built-in tools like ‘Trace Dependents’ or ‘Trace Precedents’ to ensure your consolidated data matches the source data accurately.
Can I update the graph when new data is added to sheets?

+
Yes, if you’re using dynamic named ranges or formulas that automatically expand with new data, your graphs will update as you add more information to your sheets.
What if I need to graph data from non-adjacent sheets?

+
With non-adjacent sheets, you might have to consolidate the data manually or create multiple graphs and then use Excel’s charting tools to combine them into one graph.


