5 Essential Steps to Create an Excel Stock Sheet

Creating an Excel stock sheet is crucial for businesses and individuals who wish to keep track of inventory, ensure stock levels are maintained, and manage sales efficiently. By following these five essential steps, you can develop a comprehensive and easy-to-update stock management system within Microsoft Excel.
Step 1: Set Up Your Spreadsheet Structure

Begin with the foundation of your stock sheet:
- Create headers: Name your columns appropriately, for example:
- Product ID
- Name
- Category
- Description
- Stock Level
- Unit Price
- Supplier
- Reorder Point
- Add Rows: Input products and their details under these headers.
- Freeze Panes: Freeze the header row so it remains visible as you scroll through the inventory list.
🌟 Note: Use “Freeze Panes” under the “View” tab in Excel.
Step 2: Organize Data for Easy Analysis

To maximize the utility of your stock sheet:
- Sort and Filter: Enable sorting and filtering options on your headers to sort products by name, price, or category.
- Conditional Formatting: Apply color coding to highlight:
- Low Stock
- Products Near Reorder
- Out-of-Stock Items
- Data Validation: Add drop-down lists for categories to prevent entry errors.
- Auto-Fill Formulas: Create formulas for automatic calculations like:
- Total Value of Inventory
- Profit Margins
Step 3: Implement Inventory Control Tools

Use Excel features to control inventory:
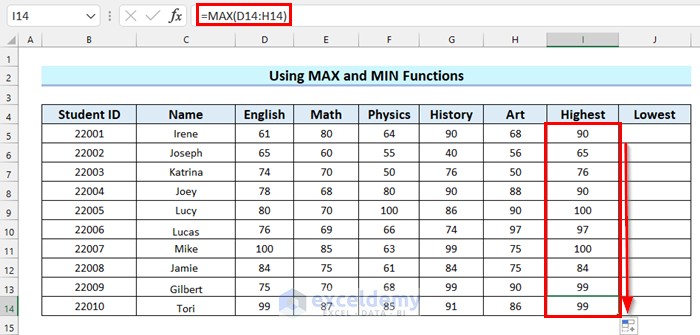
- Sum and Subtotal: Use SUM() and SUBTOTAL() functions to keep track of overall stock levels.
- IF Statements: Implement IF() to alert you when stock levels reach the reorder point.
- Data Visualization: Insert charts or sparklines to visualize inventory trends over time.
- Macro Automation: If you’re familiar with VBA, automate tasks like automatic stock replenishment orders.
⚠️ Note: For beginners, starting with simple formulas and manual checks is advisable before moving to macros.
Step 4: Track Movement of Stock

To accurately reflect stock movement:
- Track Incomings and Outgoings: Add columns for received stock and sold stock.
- Running Balance: Use a formula to calculate the running balance:
Current Stock = Initial Stock + Received Stock - Sold Stock
- Time-Stamping: Use Excel’s NOW() function to keep track of when entries are made.
- Historical Data: Keep a separate sheet or table for historical sales data.
| Product | Date | Received | Sold | Stock Balance |
|---|---|---|---|---|
| Product A | 01-01-2023 | 100 | 20 | =C2-B2+A2 |
| Product B | 02-01-2023 | 50 | 15 | =C3-B3+A3 |

Step 5: Review and Optimize Regularly

To ensure your stock sheet remains effective:
- Regular Audits: Conduct periodic physical counts to update Excel data.
- Error Checking: Check for formula errors or data entry mistakes.
- Update Stock Details: Reflect changes in product details, pricing, or suppliers.
- Optimization:
- Analyze trends to adjust reorder points.
- Remove obsolete products.
- Streamline your layout.
By implementing these five steps, you've created an Excel stock sheet that not only tracks your inventory but also provides valuable insights into your stock management. Regular updates, optimization, and the use of Excel's built-in tools will ensure your stock sheet remains a vital asset in your inventory control strategy.
Can I use an Excel stock sheet for both retail and wholesale businesses?

+
Yes, you can adapt your stock sheet for different business models by adjusting categories and implementing different stock levels for retail or wholesale pricing.
How often should I update my stock sheet?

+
It’s advisable to update stock levels daily or at least weekly, with comprehensive audits conducted monthly or quarterly.
What if I don’t know how to write Excel formulas?

+
Begin with simple formulas or explore online resources and tutorials to learn Excel functions. You can also hire experts for more complex setups.


