5 Easy Steps to Craft a Common Size Excel Sheet

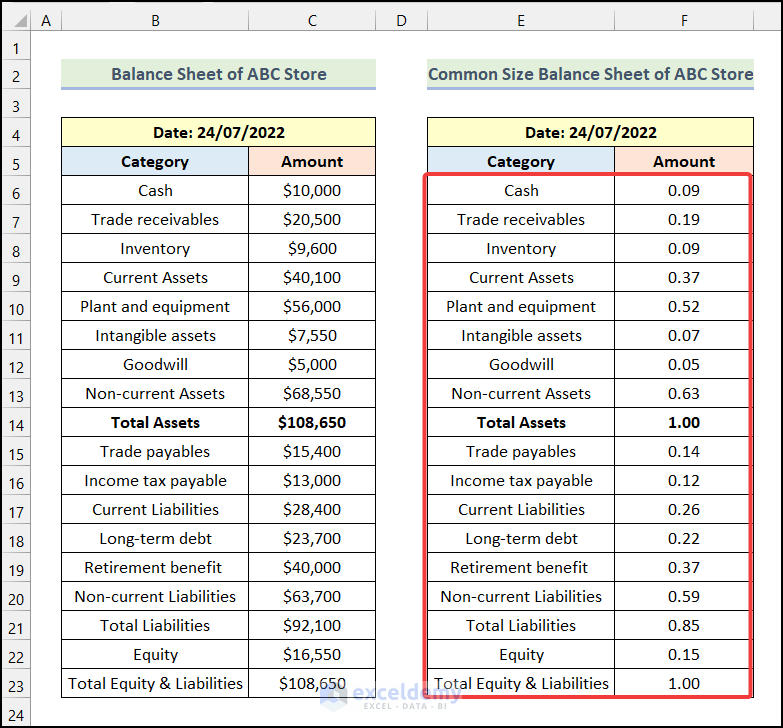
Financial analysis is a fundamental tool for businesses of all sizes, offering insights into profitability, liquidity, solvency, and efficiency. One of the most useful methods in financial analysis is creating a common size balance sheet or income statement. These statements express all line items as a percentage of a base figure, allowing for easy comparison over time or between different companies. Here, we'll walk through the 5 easy steps to craft a common size Excel sheet that will make your financial analysis a breeze.
1. Gather Your Financial Data

Before diving into Excel, you’ll need to collect your financial data:
- Balance Sheet: Assets, liabilities, and equity as of a specific date.
- Income Statement: Revenues, expenses, net income for a particular period.
Ensure your data is accurate and up-to-date to get the most out of your common size analysis.
📝 Note: Gathering the right data sets the foundation for an accurate analysis. Ensure all figures align with your accounting standards.
2. Open Microsoft Excel and Input Your Data

With your data in hand:
- Open Excel and create a new workbook.
- Enter your data for the balance sheet or income statement in a structured manner. Here’s a simple layout:
| Assets | Amount | Common Size % |
|---|---|---|
| Cash | $5000 | 10% |
| Inventory | $15000 | 30% |

Use similar layouts for liabilities, equity, revenue, and expenses.
3. Calculate the Common Size Percentages

Common size statements express each line item as a percentage of a base figure:
- For balance sheet: Divide each item by total assets.
- For income statement: Divide each item by total revenue.
To automate this:
- Sum up the total for assets, liabilities, equity, revenue, or expenses in your data.
- In the 'Common Size %' column, use the formula:
(=C2/$C$10) * 100
```
where C2 is your item, and C10 is your total base figure (e.g., total assets).
📘 Note: Ensure you lock the cell reference for the base figure with the dollar sign ($) to avoid errors during copying formulas.
4. Format Your Excel Sheet for Clarity

Good formatting helps in:
- Readability: Make headers bold, and totals stand out with borders or colors.
- Highlighting Key Figures: Use conditional formatting to highlight percentages that exceed or fall below certain thresholds.
- Enhancing Visual Appeal: Adjust decimal places for percentages, use consistent font styles, and ensure column widths are adequate.
These steps can make your common size statement not only informative but also aesthetically pleasing:
🔍 Note: Formatting in Excel enhances not just the visual appeal but also the ease with which others can interpret your financial analysis.
5. Analyze and Compare

With your common size statement ready:
- Compare changes in percentages over different periods or against industry benchmarks.
- Look for trends or anomalies. For example, a sharp rise in receivables might suggest issues with cash flow or credit policy.
- Use this analysis to make informed decisions on investments, cost management, or strategic planning.
When analyzing:
- Use tables or charts: Present your findings in a more digestible format.
- Highlight key insights: Use cell comments or annotations to explain anomalies or important data points.
📊 Note: Creating charts or graphs from your common size data can provide visual insights into financial trends and aid in presentations.
By now, you should have a well-structured common size Excel sheet that not only simplifies your financial data but also aids in making strategic business decisions. The process, while straightforward, involves key steps to ensure accuracy and comprehensiveness. Remember, the goal is to create a tool that makes financial analysis easier, allowing you to quickly identify trends, understand financial structure, and compare performance with past periods or industry averages. Use these insights to craft a narrative around your company's financial health, make forecasts, and plan for future growth or adjustments in your business strategy.
Why use a common size statement?

+
Common size statements allow for easy comparison over time or between companies by standardizing financial data. It highlights the proportional significance of each line item, which is invaluable for trend analysis and benchmarking.
Can common size statements be used for forecasting?

+
Yes, common size statements can aid in forecasting by providing a historical perspective on how percentages of different accounts have changed over time. This can help predict future trends when combined with other forecasting methods.
What to do if percentage calculations seem off?

+
Double-check your data inputs for accuracy. Ensure the base figure for your common size calculation is correctly chosen (total assets for balance sheet, total revenue for income statement), and that formulas are correctly applied without dragging errors from cell references.
How often should I prepare a common size statement?

+
Preparing a common size statement quarterly or annually can be sufficient for most businesses. However, companies experiencing rapid changes might benefit from monthly or even weekly updates.


