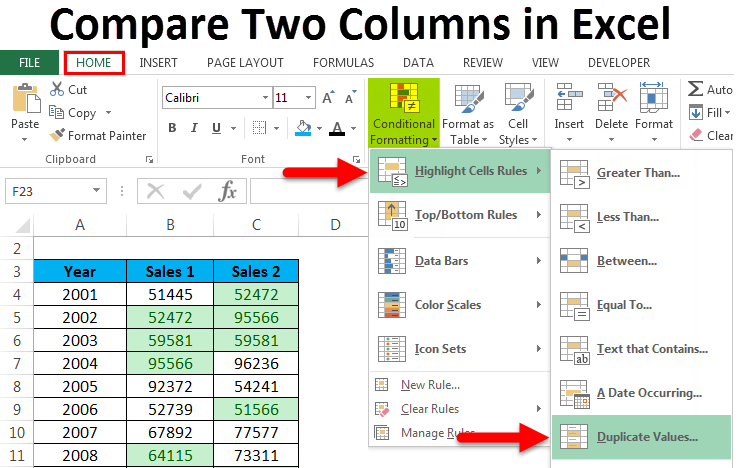
5 Easy Steps to Compare Excel Columns in Google Sheets

In today's data-driven work environment, it's common to need to compare data across different spreadsheets. While Microsoft Excel is a powerhouse for data analysis, Google Sheets offers a cloud-based, collaborative platform which is increasingly popular. This guide will walk you through five easy steps to compare Excel columns in Google Sheets, enhancing your productivity by leveraging the strengths of both tools.
Step 1: Prepare Your Data in Excel

Before you can compare data in Google Sheets, ensure your Excel data is well-organized:
- Open your Excel file.
- Select the relevant columns or ranges you wish to compare.
- Copy this data to your clipboard.
📝 Note: Ensure you’re selecting the right columns to avoid comparing irrelevant data.
Step 2: Export Data to Google Sheets

Navigate to Google Sheets:
- Go to sheets.google.com or open Google Sheets from your Google Drive.
- Create a new blank spreadsheet or open an existing one.
- Paste the data from your clipboard into Google Sheets. If there’s a difference in formatting or data structure, ensure to align it manually:
📌 Note: Google Sheets might not perfectly import complex Excel formulas, so double-check your data integrity after pasting.
Step 3: Use Conditional Formatting for Visual Comparison

Google Sheets offers powerful conditional formatting tools:
- Select the columns you want to compare.
- Go to Format > Conditional formatting in the menu.
- Choose to highlight cells that are not equal to a value or formula, then compare your columns. For example, to highlight differences:
- Click ‘Add another rule’.
- Set ‘Format cells if…’ to ‘Custom formula is’.
- Enter a formula like =A2<>B2 where A and B are your columns.
- Select a distinct color for easy identification.
Step 4: Use Google Sheets Functions to Compare Data

Utilize functions like VLOOKUP, INDEX MATCH, or ARRAYFORMULA to automate your comparison:
- VLOOKUP: Find if a value in one column exists in another column.
- INDEX MATCH: Compare arrays or vertical lookups with better performance.
- ARRAYFORMULA: Perform operations across an entire range or column.
🖥 Note: Google Sheets has limits on the number of cells you can process in one go. Be mindful of large datasets.
Step 5: Analyze and Document Findings

After comparison:
- Analyze the results. Look for patterns or significant discrepancies.
- Document these findings. You might:
- Highlight or note specific cells with differences.
- Add comments or notes directly in Google Sheets.
- Use Sheets’ comments or notes feature for collaborative analysis.
- Create a summary table using the ‘’ tag to present your findings:

Column A Column B Discrepancies Data Point 1 Data Point 1 Match Data Point 2 Data Point X Difference
📌 Note: Real-world data often contains nuances, so ensure you understand any differences before making decisions.
By following these five steps, you can easily compare Excel columns in Google Sheets. This method not only allows for effective data analysis but also promotes collaboration through Google's cloud capabilities. Remember, the key to a successful comparison is in meticulous preparation and the intelligent use of Google Sheets' features to streamline your work.
Can I compare multiple sheets within one Google Sheets document?

+
Yes, you can compare data across different sheets in the same Google Sheets file by using formulas or by creating pivot tables from multiple sheets.
What if the data structures in Excel and Google Sheets are different?

+
When data structures differ, manually align your data after pasting or use Google Sheets functions to restructure data, ensuring you’re comparing the intended data points.
How do I handle large datasets for comparison?

+
Use Google Sheets’ ARRAYFORMULA function to apply comparison across large datasets, but remember the processing limits of Google Sheets for performance reasons.
What if I only need to compare specific cells or rows?

+
You can compare specific cells or rows by using conditional formatting rules or functions like IF statements, focusing on the specific data points.


