Combine Excel Sheets in Tableau Effortlessly
In today's data-driven world, merging data from multiple sources is a common task for data analysts, business intelligence professionals, and data enthusiasts. Among the various tools available for this purpose, Tableau stands out for its ease of use and powerful visualization capabilities. This blog post will guide you through the process of comburing Excel sheets in Tableau, a task that might seem daunting at first but is actually quite straightforward once you understand the steps involved.
What is Excel and How Does it Relate to Tableau?

Excel, part of the Microsoft Office suite, is a widely used spreadsheet application that offers a range of features for data analysis, from basic arithmetic to complex data modeling. While Excel is excellent for small to medium-sized datasets, its capabilities can become limited when dealing with larger datasets or when visualizations are needed.
Tableau, on the other hand, is a powerful data visualization and business intelligence tool designed to transform raw data into insightful, interactive dashboards and reports. Here are key ways Tableau and Excel relate:
- Excel files can be connected to Tableau as a data source.
- Tableau can handle multiple Excel sheets within the same file or from different files.
- Data from Excel can be visually represented, analyzed, and interactively explored in Tableau.
How to Combine Multiple Excel Sheets in Tableau

Combining Excel sheets in Tableau is a versatile process that allows you to merge data from different sources efficiently. Here's a step-by-step guide:
Step 1: Prepare Your Excel Files
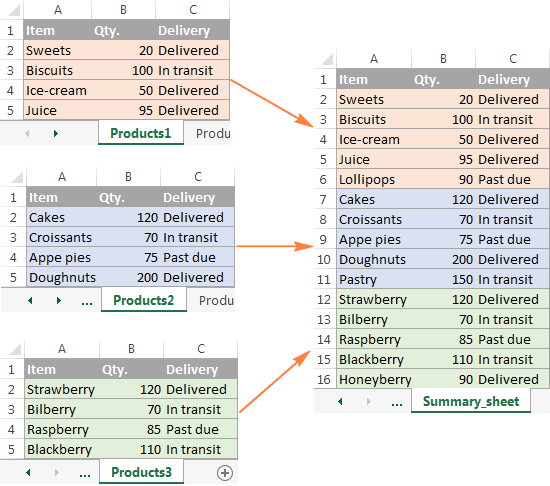
- Ensure Consistency: Check that the column names and data types in your sheets are consistent where possible. This will help in aligning data during the merge.
- File Structure: Multiple sheets can be in a single Excel workbook or separate files, but organizing them efficiently will simplify the merging process.
Step 2: Open Tableau and Connect to Excel Data

- Open Tableau Desktop or Tableau Public.
- Select ‘Microsoft Excel’ from the list of available connections in the ‘To a File’ section.
- Navigate to your Excel file(s) and select ‘Open’.
💡 Note: If you're using multiple Excel files, you might need to connect to each file separately and then merge them within Tableau. For a single file with multiple sheets, proceed with the steps below.
Step 3: Connect to Multiple Sheets

- After opening an Excel file, you’ll see a list of worksheets or named ranges on the left side of the Tableau screen.
- Check the boxes next to each sheet you want to combine. If sheets are within the same workbook, this is where you’d select them all at once.
- Click on the sheet icon next to the workbook name to review or set up the connection properties for each sheet.
Step 4: Merge Data
There are several methods to merge data in Tableau:
Join
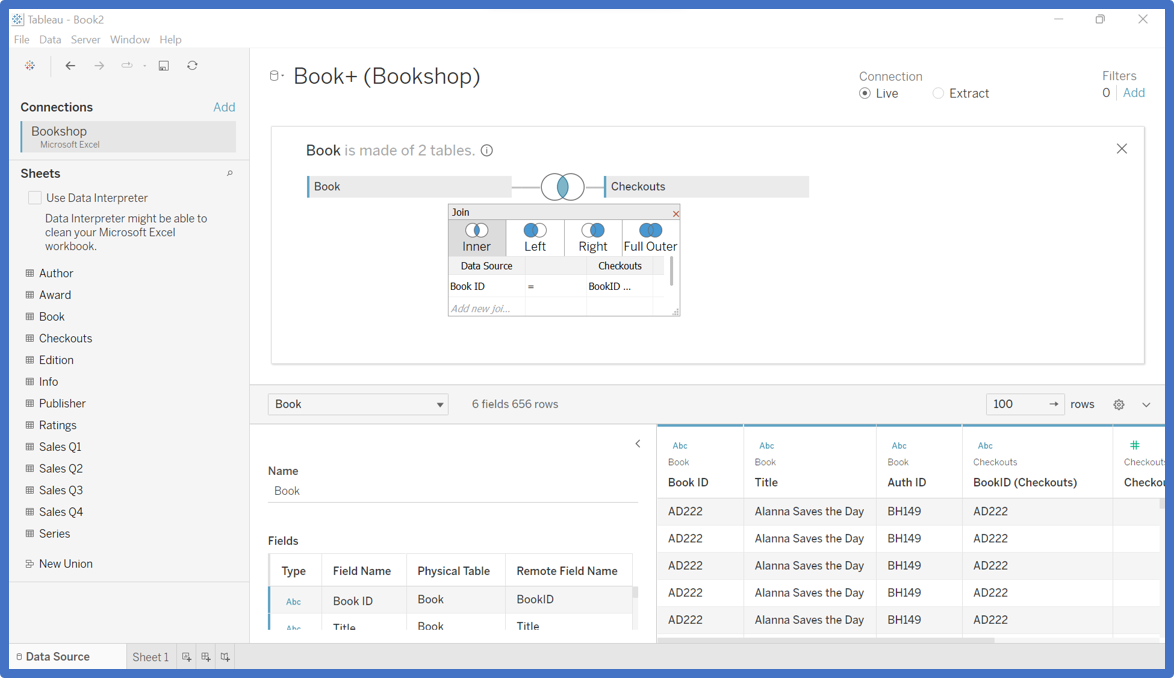
- Drag a data source into the left side of the Data pane. This creates a temporary table called a Join.
- Add another table to the canvas by dragging another data source. A relationship between the tables will be suggested automatically, or you can click on the join to specify the relationship manually.
- Join Types: Use Inner, Left, Right, or Full Outer joins depending on your data requirements.
| Join Type | Description |
|---|---|
| Inner Join | Matches only common records between the tables. |
| Left Join | Includes all records from the left table and matched records from the right table. |
| Right Join | Opposite of a Left Join, including all records from the right table. |
| Full Outer Join | Includes all records from both tables, matching where possible. |
Union
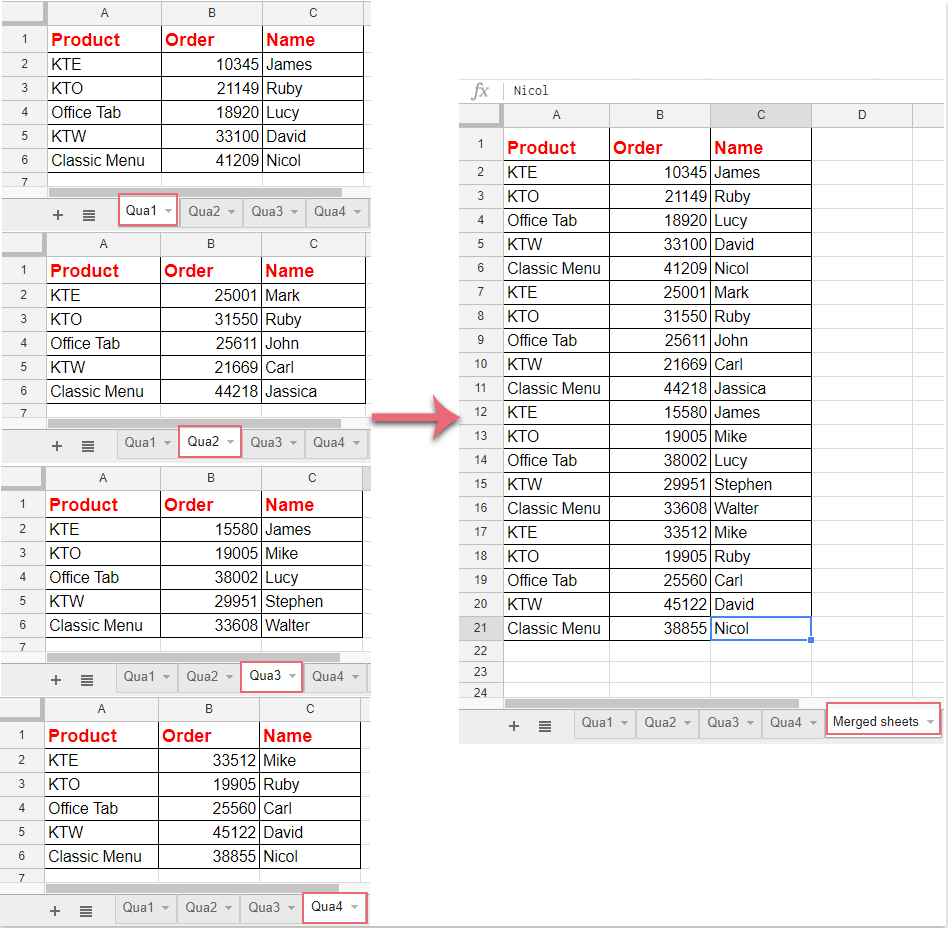
- Select the sheets you want to combine in the left pane.
- Right-click and choose ‘Union’, which will stack the data vertically, assuming a similar structure.
Blends
- If data comes from different databases or can’t be joined due to different granularity, blending can be used.
- Create separate data sources, then blend them using the Data Source pane’s relationship panel.
💡 Note: Union should be used when the structure of tables is similar, whereas Joins or Blends are better when dealing with varying structures or linking data with different levels of detail.
Optimizing the Merged Data for Visualizations
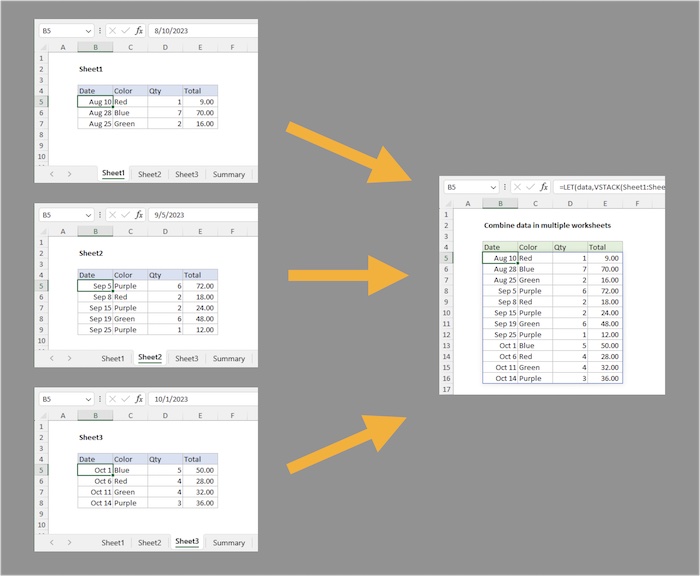
Once you’ve merged your data in Tableau, optimizing it for visualization can significantly enhance its usefulness:
- Aggregations: Decide if you need to aggregate data at the time of merging or before it.
- Data Quality: Check for inconsistencies, duplicates, and other data quality issues.
- Relationships: Ensure that relationships are properly set up for accurate visualizations.
💡 Note: Sometimes, you might need to preprocess your data in Excel before merging in Tableau to ensure data quality.
Conclusion
To wrap up, merging Excel sheets in Tableau is a process that empowers you to combine datasets in various ways, providing a robust foundation for data analysis and visualization. With the ability to join, union, or blend data, you’re not confined to single-sheet analytics but can explore and represent complex relationships in your data. Remember, the quality of your visualizations heavily depends on the quality and organization of your data from the outset. By following these steps, you’ll be well on your way to creating insightful visualizations from multiple Excel sources.
Can I combine sheets from different Excel files in Tableau?
+
Yes, you can combine sheets from multiple Excel files in Tableau by connecting to each file as a separate data source and then using Joins, Unions, or Blends to combine the data.
What’s the difference between a Union and a Join?
+
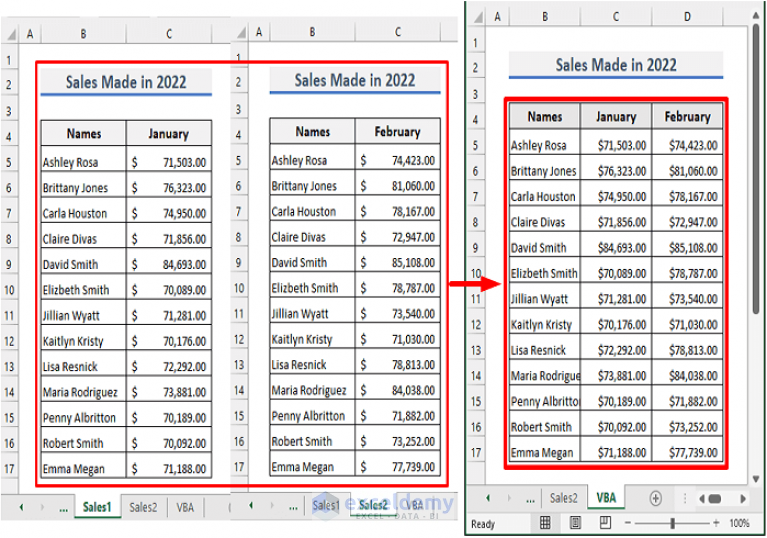
A Union adds datasets vertically, stacking them in a way that assumes similar structure. A Join, however, links datasets horizontally based on matching keys or fields.
How can I manage data quality issues during the merging process?

+
Preprocess your data in Excel to clean it, ensure consistent formatting, remove duplicates, and verify data types. Additionally, use Tableau’s data preparation features to further refine the data as you merge.


