5 Easy Ways to Categorize Data in Excel

Data categorization is a fundamental aspect of managing information in any spreadsheet application, including Microsoft Excel. It's not just about making data look organized but also about enhancing efficiency, improving analysis, and making data-driven decisions much easier. Whether you're a business analyst, a student, or someone who loves data, mastering Excel's categorization tools can save you a tremendous amount of time and effort. Here, we'll explore five effective ways to categorize data in Excel, each method tailored for different scenarios and levels of complexity.
1. Sorting Data by a Single Column


Sorting is the simplest form of data categorization. Here’s how to sort data in Excel by a single column:
- Select the Column: Click on the header of the column you wish to sort by.
- Sort: Navigate to the Data tab, and choose either ‘Sort A to Z’ or ‘Sort Z to A’. For numerical data, this translates to ascending or descending order respectively.
This method works best when you have one primary criterion for organizing your data.
2. Using Filters


Filters provide a dynamic way to categorize data by allowing you to display only the rows that meet your criteria:
- Apply Filters: Select your data range or click inside a table. Go to the Data tab and click ‘Filter’. Dropdown arrows will appear in the headers.
- Filter Options: Click the arrow in the column header and choose your filter options. You can filter by text, numbers, dates, and even custom criteria.
This method allows for more granular control over what data you want to see, making it excellent for exploring subsets of data.
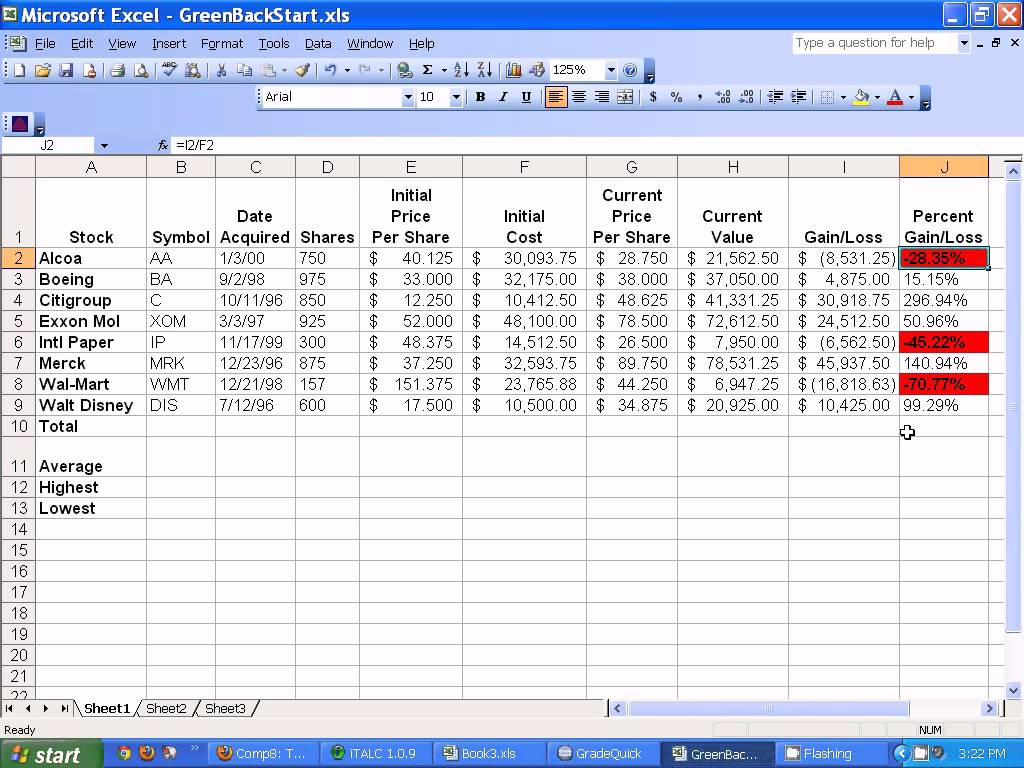
3. Conditional Formatting


Conditional Formatting helps you visually categorize data through color scales, data bars, and icon sets:
- Select Data: Highlight the cells you want to format.
- Apply Formatting: Go to Home > Conditional Formatting. Choose from options like ‘Data Bars’ to categorize by value magnitude, or ‘Color Scales’ for a more nuanced approach.
This method is visually intuitive, helping users quickly understand data trends without altering the actual data set.
4. Grouping and Outlining


Grouping and outlining can be used to categorize data hierarchically, making it easier to analyze complex datasets:
- Create Groups: Select the rows or columns you want to group. Go to Data > Group. Excel will display level buttons at the top, allowing you to expand or collapse groups.
- Outlining: Use the ‘Subtotal’ feature to automatically group data based on specified criteria, such as grouping sales by region.
This method is particularly useful for financial analysis or when working with hierarchical or multi-level data.
5. PivotTables


PivotTables are one of Excel’s most powerful tools for data analysis and categorization:
- Create a PivotTable: Select your data range and go to Insert > PivotTable. Excel will suggest a location for the PivotTable; accept or change it as needed.
- Categorize: Drag fields into the Rows, Columns, Values, and Filters areas to rearrange and summarize your data dynamically.
PivotTables excel in summarizing and cross-tabulating data, enabling you to perform complex categorizations in an interactive manner.
💡 Note: When dealing with large datasets, consider using Excel Tables. Converting your range to a table provides structured references and dynamic formatting that makes sorting and filtering even easier.
To sum up, Excel offers a variety of tools to help users categorize data effectively. From simple sorting to the complex analysis with PivotTables, these methods can enhance data organization, analysis, and presentation, making your work with data both more efficient and insightful. Remember, the key is to choose the right tool for the task at hand, ensuring your data management is both productive and accurate.
How can I quickly revert changes made by sorting or filtering in Excel?

+
To undo changes made by sorting or filtering, you can either use the ‘Undo’ button (Ctrl + Z) right after performing the action or restore your data from a backup if the changes were made a while ago.
Can I combine different categorization methods in Excel?

+
Absolutely! For instance, you can use filters alongside conditional formatting to highlight categories within a subset of data, or use grouping to enhance PivotTable analysis for a more in-depth view of your data.
Is there a way to automate data categorization in Excel?

+
Yes, by using macros (VBA scripting) or Power Query (Get & Transform Data in newer Excel versions), you can automate sorting, filtering, and even creating complex categorizations based on custom logic.
What’s the best practice for dealing with large datasets in Excel?

+
Use Excel Tables, utilize Power Pivot for in-depth analysis, and consider using Excel’s Power Query to manage and transform data before loading it into your workbook. These tools handle large datasets more efficiently.
Are there any limitations to consider when using Excel for data categorization?

+
Excel has a row limit of 1,048,576 and a column limit of 16,384. For extremely large datasets, you might need to consider more specialized tools like SQL or cloud-based data analysis platforms.


