Calculate Percentages Easily in Excel: Quick Guide

Introduction to Calculating Percentages in Excel

Microsoft Excel is a powerful tool that offers numerous functions to perform various calculations, from simple arithmetic to complex financial computations. One common calculation task many users encounter is calculating percentages. Whether you’re a student, a business professional, or just someone who loves organizing their data, understanding how to work with percentages in Excel can streamline your tasks immensely. In this guide, we’ll explore different methods to calculate percentages efficiently and accurately.
Why Calculate Percentages in Excel?

Before diving into the mechanics, let’s consider why you might want to use Excel for percentage calculations:
- Automation: Excel allows you to set up formulas once and apply them to multiple rows or columns, reducing manual errors.
- Flexibility: You can easily adjust data without recalculating everything by hand.
- Visualization: Excel’s charting tools make it simple to visualize percentage data through pie charts, bar graphs, and more.
- Analysis: Perform in-depth analysis on percentages for financial reports, sales forecasts, or academic grading.
Basic Percentage Calculations

Percentages are essentially fractions or ratios expressed out of 100. Here are the fundamental calculations you’ll often use:
Calculating a Percentage of a Number

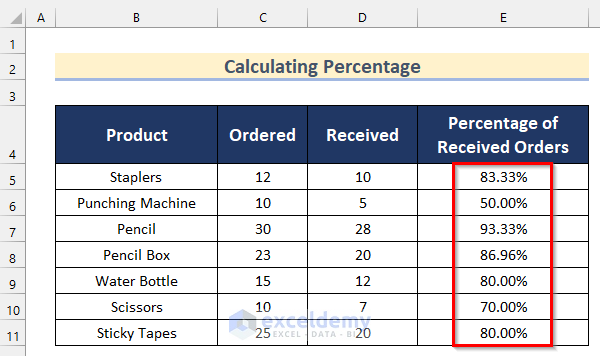
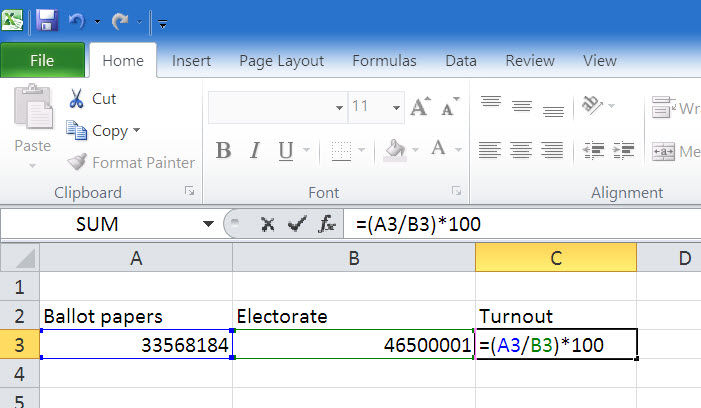
To find out what percentage one number is of another, use this formula:
Percentage = (Part / Whole) * 100
Let’s say you want to know what 25 is as a percentage of 100:
| Part | Whole | Formula | Result |
|---|---|---|---|
| 25 | 100 | = (25 / 100) * 100 | 25% |

💡 Note: If your data includes cells with percentages already formatted, Excel might automatically convert them to decimals when calculating, which can be adjusted in the cell formatting.
Calculating the Total from a Percentage

To determine the total when you know the percentage and the part, use this formula:
Whole = Part / (Percentage / 100)
If 25 is 10% of the total, the total is calculated as:
| Part | Percentage | Formula | Result |
|---|---|---|---|
| 25 | 10% | = 25 / (10 / 100) | 250 |
Increasing or Decreasing a Number by a Percentage

If you want to increase or decrease a number by a certain percentage, here are the formulas:
- To increase:
New Value = Original Value + (Original Value * Percentage / 100) - To decrease:
New Value = Original Value - (Original Value * Percentage / 100)
Calculating Growth Rate or Rate of Change

Understanding the growth rate or rate of change over time is valuable for analysts and marketers:
Growth Rate = (New Value - Original Value) / Original Value * 100
If sales increased from 50 to 75 over a year:
| Original Value | New Value | Formula | Result |
|---|---|---|---|
| 50 | 75 | = (75 - 50) / 50 * 100 | 50% |
Using Excel’s Built-in Functions for Percentages

Excel has several functions that can help you with percentage calculations:
- Percentile and Percentile.inc: These functions help find the n-th percentile of given data sets.
- Percentrank and Percentrank.inc: They return the rank of a value as a percentage of a data set.
- Per / Total: A quick way to get percentage breakdowns in pivot tables.
Formatting Cells as Percentages

Proper formatting is crucial for readability:
- Select the cells where you want to display percentages.
- Right-click and choose
Format Cellsor use the ribbon:Home > Number > Percent Style. - Choose the desired number of decimal places for your percentages.
🔔 Note: Formatting does not change the actual cell value, only how it’s displayed; use formatting judiciously to prevent confusion.
Visualizing Percentages with Charts

Charts are an effective way to present percentage data:
- Pie Chart: Excellent for showing how parts relate to a whole.
- Bar Graph: Great for comparing percentages across categories.
- Line Chart: Useful to illustrate trends or changes over time in terms of percentage.
Creating a Percentage Distribution Table

Sometimes, you might want to show how various elements contribute to a total percentage:
| Category | Percentage |
|---|---|
| Technology | 40% |
| Marketing | 25% |
| Operations | 35% |
This table is particularly useful in business scenarios where stakeholders need a quick overview of resource allocation or sales distribution.
In summary, Excel’s capabilities for percentage calculations go beyond simple arithmetic. It allows for complex manipulations, financial analyses, and visual representation of data. By mastering these methods, you can make data-driven decisions with greater confidence and clarity, turning raw numbers into insightful visualizations and reports.
What if my percentage values are showing as decimals?

+
If your percentages appear as decimals, you likely need to format the cells. Click on the cells, then select “Format Cells” or use the Percent Style button in the Home tab. Remember that formatting does not change the underlying value, only how it’s displayed.
Can I use Excel for more complex financial calculations?

+
Yes, Excel is equipped with functions like PMT, FV, PV, and others for financial calculations, including loans, investments, and depreciation schedules.
How do I make my percentage charts more engaging?

+
You can enhance charts by using custom colors, adding labels, adjusting chart styles, or creating combo charts that mix chart types for visual impact.


