Master Adding Multiple Pivot Tables in One Excel Sheet Easily

Mastering the art of managing data in Excel involves various skills, one of which is the ability to add multiple pivot tables within a single sheet. This capability enhances productivity, allowing users to analyze different datasets without the clutter of multiple tabs. In this comprehensive guide, we'll delve into the step-by-step process of how to integrate multiple pivot tables into a single Excel sheet, ensuring your data analysis is both effective and efficient.
Why Use Multiple Pivot Tables?

Before diving into the how-to, it’s essential to understand the why behind using multiple pivot tables:
- Comparative Analysis: Analyze different segments or time periods within the same dataset or across datasets.
- Data Segmentation: Break down complex data into manageable parts for more focused analysis.
- Efficiency: Streamline reporting by presenting multiple analyses on one page.
Creating Your First Pivot Table

Begin by selecting your data range or table, ensuring your dataset is in a tabular format:
- Navigate to the Insert tab.
- Click on PivotTable. A dialog box will appear asking for the data source.
- Select Table/Range and choose your data range.
- Decide where you want the pivot table to be placed (New Worksheet or Existing Worksheet).
- If placing it in an existing worksheet, specify the location by selecting a cell for the top-left corner of the pivot table.
- Click OK.
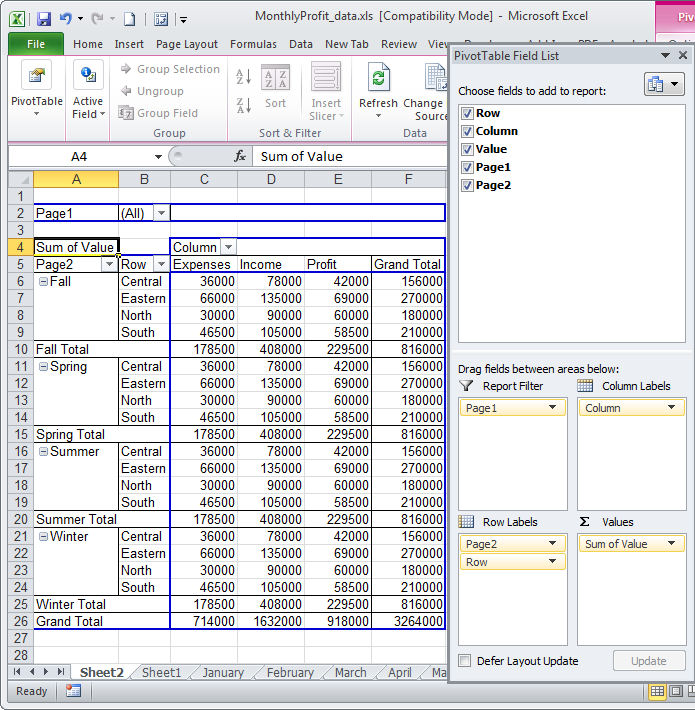
- In the PivotTable Field List, drag fields to the Rows, Columns, Values, and Filters areas to design your pivot table.
Adding Another Pivot Table in the Same Sheet

Now that you have one pivot table, let’s add another:
- Repeat steps 1-4 from the first pivot table creation process.
- When choosing where to place the new pivot table, select the same worksheet but pick a different cell for its top-left corner. Ensure there is enough space around it for potential expansion.
- After clicking OK, a new pivot table appears. Configure this table with different data fields or the same fields but with different filters or calculations to meet your analysis needs.
🌟 Note: Multiple pivot tables in the same sheet should not overlap to prevent any functionality issues.
Formatting Your Pivot Tables

To make your pivot tables visually appealing and easier to interpret, consider these formatting tips:
- Consistent Formatting: Use a consistent color scheme for headers or summaries.
- Conditional Formatting: Highlight data points that meet certain criteria for quick analysis.
- Formatting Options: Right-click the pivot table and select Format to access more options.
Managing Multiple Pivot Tables

Here are some key points to consider when managing more than one pivot table:
- Independent Refreshing: Pivot tables can be refreshed independently. Click within any pivot table and select Refresh to update its data.
- Customization: Each pivot table can have its own filters, calculations, and grouping settings.
- Interactive Elements: Use slicers or timelines for linked filtering across multiple pivot tables.
✨ Note: Slicers linked to multiple pivot tables can be created by holding the Ctrl key while selecting each pivot table for connection.
Advanced Tips for Multiple Pivot Tables

- Use Formulas: Incorporate GETPIVOTDATA formulas to pull data from pivot tables into cells for further analysis or reporting.
- Power Query: For extensive datasets, use Power Query to streamline data preparation before pivot analysis.
- Dynamic Source: Ensure your pivot tables use dynamic ranges or tables that update as new data is added.
🎯 Note: Ensure to name your pivot tables using the PivotTable Analyze tab for easier reference in macros or formulas.
By now, you've learned how to add, manage, and format multiple pivot tables within a single Excel sheet. This skill can elevate your data analysis to a new level, offering insights that are more precise and actionable. Whether you're analyzing sales figures, marketing campaigns, or operational efficiencies, the techniques outlined here will streamline your workflow and enhance your reporting capabilities.
Incorporating these strategies into your Excel toolkit allows you to present data in multiple ways, providing stakeholders with the flexibility to interpret the data from different perspectives. Moreover, you'll save time by having all your analyses in one place, making it easier to spot trends, make comparisons, and draw conclusions.
Remember, mastery in Excel isn't just about knowing the functions but understanding how to leverage them in real-world scenarios. By experimenting with multiple pivot tables, you'll become adept at extracting maximum insights from your datasets, turning complex data into actionable intelligence.
Can I link pivot tables so that one filter affects all of them?

+
Yes, by using slicers or timelines, you can link filters between multiple pivot tables. Hold the Ctrl key while selecting the pivot tables you want to connect, then create a slicer or timeline and it will control filtering for all linked tables.
What are the limitations of using multiple pivot tables in one sheet?

+
The primary limitation is the potential for space constraints, especially if pivot tables expand significantly. Also, overlapping or poorly positioned tables can interfere with functionality. It’s essential to manage space effectively.
Can I use the same data source for different pivot tables?

+
Absolutely. You can use the same data source to create multiple pivot tables, each with different configurations to analyze the data in various ways.


