5 Ways to Track Data Efficiently in Excel

Data tracking and analysis are critical functions in today's business environment. Excel is one of the most widely used tools for this purpose, offering a flexible platform for managing data in various forms. Whether you are tracking sales, inventory, project timelines, or any other metrics, Excel provides tools to make this task more efficient. In this blog post, we will explore five effective strategies for tracking data in Excel, enhancing your ability to analyze and visualize information.
1. Use PivotTables for Dynamic Data Analysis


PivotTables are incredibly powerful for summarizing, analyzing, exploring, and presenting your data. Here’s how to leverage them for efficient data tracking:
- Set Up Your Data: Ensure your data is in a tabular format with headers. Each column should have a unique name.
- Create a PivotTable: Go to ‘Insert’ > ‘PivotTable’ and choose where you want the PivotTable to be placed.
- Analyze Data: Drag fields to Rows, Columns, Values, and Filters to see different views of your data. You can:
- Summarize data by totals, averages, counts, etc.
- Filter data to show only what’s relevant.
- Change data at will to view from different perspectives.
📌 Note: Data should be organized cleanly; errors in data structure can lead to misleading results in PivotTables.
2. Implement Data Validation for Consistency


To ensure data accuracy and consistency:
- Apply Data Validation Rules: Go to ‘Data’ > ‘Data Validation’ to set up rules for data entry like:
- Allow only certain values (e.g., a dropdown list of categories).
- Restrict numeric input within a specific range.
- Provide input messages to guide users.
- Custom Validation: For more complex validation, use custom formulas.
- Error Alert: Set up custom error messages to inform users when they violate validation rules.
⚠️ Note: Overuse of validation can make data entry cumbersome; balance is key.
3. Use Conditional Formatting for Visual Tracking

Excel’s conditional formatting helps in visually tracking data:
- Highlighting Key Data: Use color scales, data bars, or icon sets to indicate data trends or outliers.
- Data Bars: These are particularly useful for comparing lengths visually.
- Highlight Cell Rules: Automatically highlight cells based on predefined conditions.
Conditional formatting not only makes data analysis easier but also aids in spotting trends or issues quickly.
4. Utilize Excel Tables for Organized Data

Converting your data range into a Table in Excel provides numerous benefits:
- Auto-Expand: Tables automatically adjust when new data is added.
- Consistent Formatting: Tables ensure that all rows and columns have consistent formatting.
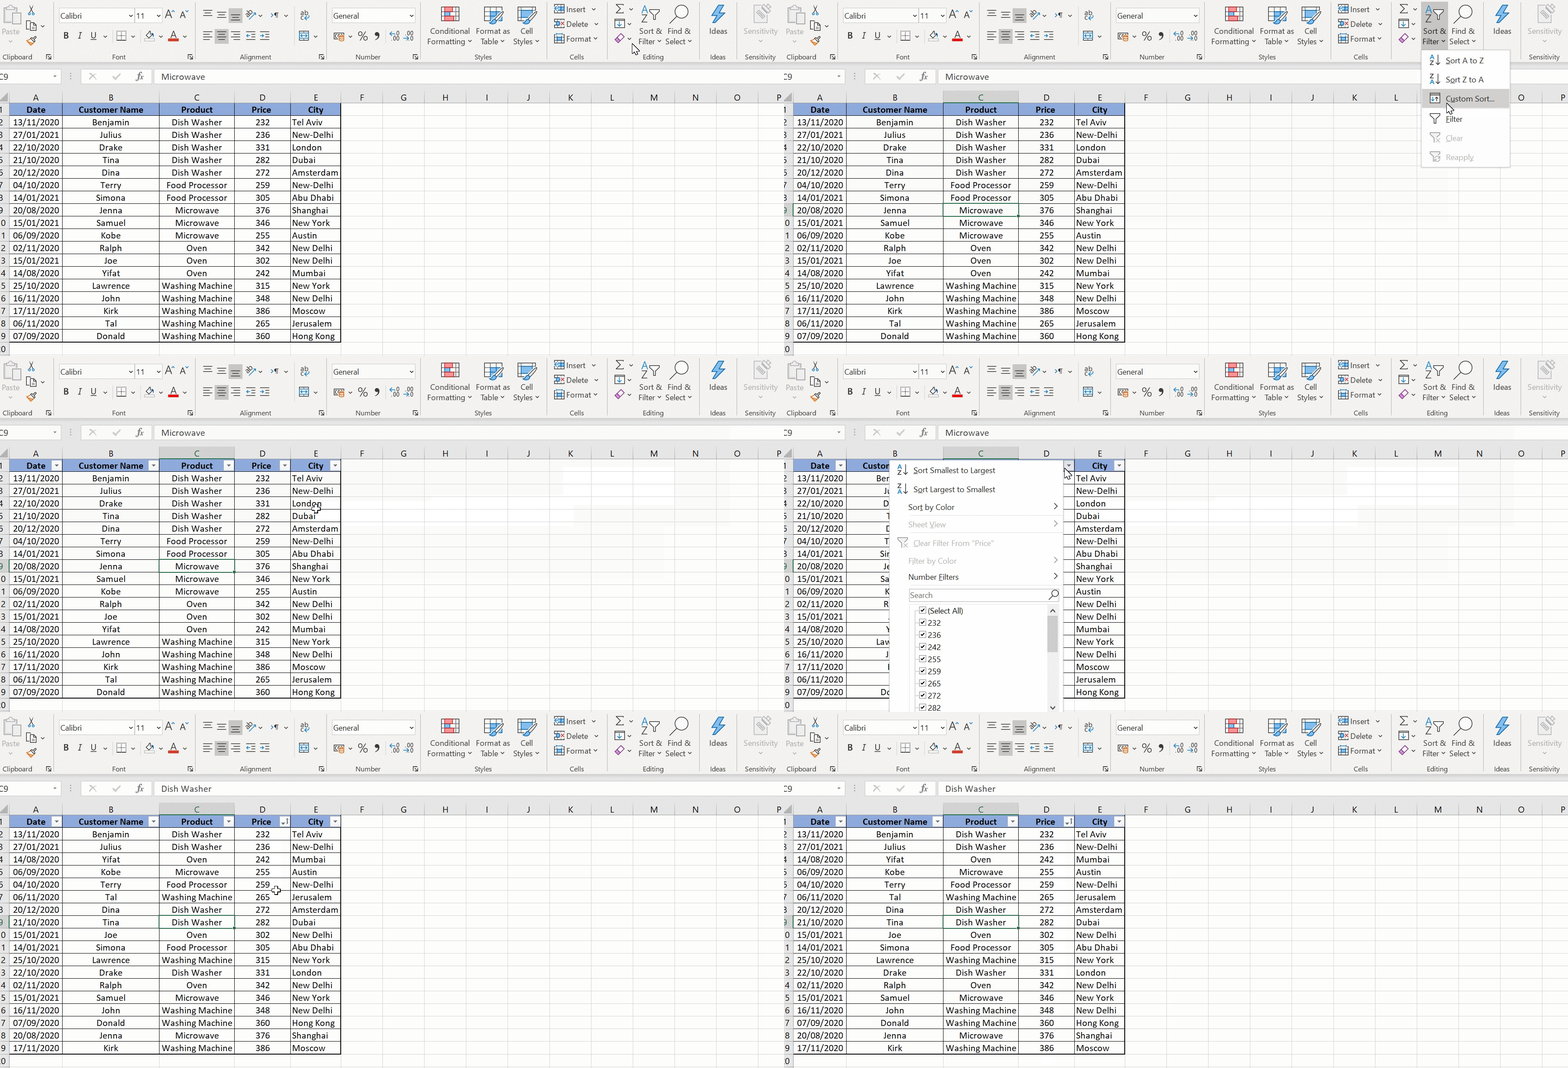
- Easy Sorting and Filtering: Built-in features for sorting and filtering data.
- Structured References: Formulas that refer to tables are more readable and less error-prone.
Here’s how you create a Table:
- Select the range of your data.
- Go to ‘Insert’ > ‘Table’ or press ‘Ctrl + T’.
- Confirm that your data has headers.
Using Tables also makes it easier to integrate with features like Power Query, enhancing data management further.
5. Employ Macros for Repetitive Tasks


Automation through macros can significantly boost efficiency:
- Record a Macro: For repetitive tasks, record your actions, then customize the VBA code if needed.
- Assign Macros to Buttons: Make running macros accessible through clickable buttons.
- Automate Data Entry: Macros can input data, format cells, or run reports automatically.
Here is how you might start:
- Go to ‘Developer’ Tab (if not visible, enable it in Options > Customize Ribbon).
- Click ‘Record Macro’, perform your task, then stop recording.
- Assign the macro to a button for ease of access.
💡 Note: VBA macros require some learning but can be a powerful tool for automation.
To wrap up, Excel offers a plethora of tools for efficient data tracking. From the dynamic data analysis capabilities of PivotTables, to ensuring data integrity with validation, to visual aids through conditional formatting, Tables for structured organization, and automation with macros, Excel has something for every data analyst. By leveraging these five strategies, you can enhance your ability to track, analyze, and manage data, leading to more informed decision-making and improved productivity.
What are the benefits of using PivotTables for data tracking in Excel?

+
PivotTables allow for dynamic data manipulation, enabling users to quickly summarize, explore, and present data in various configurations without altering the source data.
Can data validation in Excel help prevent errors?
+
Yes, data validation rules ensure data consistency by restricting input to predefined criteria, thus reducing errors from data entry.
How do Excel Tables differ from regular data ranges?

+
Tables in Excel automatically adjust to new data, provide easier sorting and filtering, and support structured references, making data management more efficient and organized.


