5 Ways to Separate Pages in Excel Sheets
Efficient Document Management: 5 Ways to Separate Pages in Excel Sheets
One of the greatest challenges in managing data with Microsoft Excel is organizing it effectively. Whether you're compiling reports, tracking project progress, or managing financial spreadsheets, knowing how to divide or separate pages in Excel can significantly improve readability, analysis, and collaboration. In this blog, we will delve into five practical methods to organize your Excel sheets, enhancing both the aesthetics and functionality of your spreadsheets.
1. Using Page Breaks

Page breaks are a simple yet effective way to divide your data into distinct pages for printing or viewing purposes.
- Manual Page Breaks: Click where you want to insert the break, navigate to the “Page Layout” tab, and select “Breaks” then “Insert Page Break.”
- Automatic Page Breaks: Excel automatically sets page breaks based on the paper size and margin settings, but you can adjust these in the “Page Setup” dialog under the “Page Layout” tab.
Using page breaks ensures that your data prints or displays correctly on separate pages.
📝 Note: After inserting page breaks, check the “Print Preview” to ensure your layout aligns with your expectations.
2. Utilizing Multiple Worksheets

Instead of cluttering a single worksheet with excessive data, you can distribute your information across multiple tabs. This method is particularly useful for:
- Categorizing Data: Each tab can represent different departments, time periods, or categories of information.
- Linking Data: Use Excel’s formula capabilities like =SUM(Sheet2!A1:A10) to aggregate data from different sheets.
This approach not only keeps your data organized but also makes it easier to navigate.
3. Conditional Formatting to Highlight Data Segments

While not a traditional page separator, conditional formatting can act as a visual divider:
- Change Cell Backgrounds: Use different colors or patterns to visually separate data.
- Data Bars: Fill cells with gradient or solid bars to distinguish sections of data.
Conditional formatting provides an at-a-glance differentiation of data, which can help in quickly identifying sections.
4. Splitting Your Window for Side-by-Side Viewing
This feature allows you to view different parts of the same worksheet simultaneously:
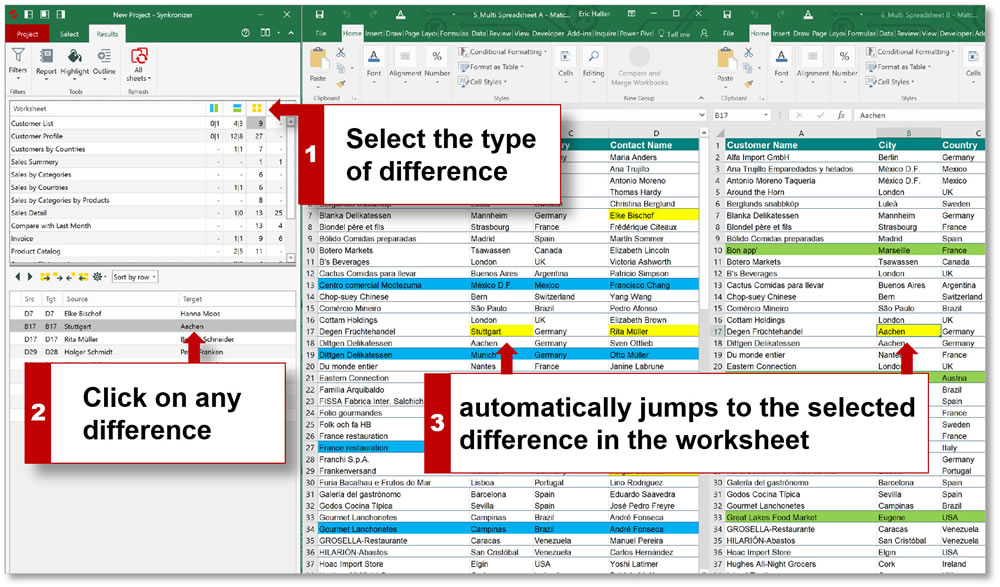
- Horizontal Split: Split the window horizontally by selecting “View” > “Window” > “Split.”
- Vertical Split: Drag the split line vertically to separate the view.
With this, you can compare or analyze different sections of your Excel sheet without scrolling.
5. Grouping and Outlining for Collapsible Data

Excel allows for creating outlines that can collapse or expand sections of your data:
- Grouping Rows or Columns: Select the rows or columns you want to group and use “Data” > “Group.”
- Outlining: Excel automatically creates outlines for grouped data, making it easy to collapse for an overview or expand for detail.
Grouping and outlining are excellent for managing extensive data sets by hiding unnecessary detail when not required.
To wrap up, organizing data in Excel through separation techniques not only enhances the user experience but also streamlines your data management. Each method discussed here offers unique advantages for different scenarios, making your Excel spreadsheets more functional and professional. Remember, a well-organized Excel document not only looks better but also allows for faster analysis and less errors in data handling.
Can I set automatic page breaks to optimize for different paper sizes?

+
Yes, in Excel, you can adjust the automatic page breaks by modifying the page setup, which includes options for different paper sizes, margins, and scaling.
How do I move or resize manual page breaks after inserting them?

+
By switching to Page Break Preview mode, you can manually drag or adjust the page breaks to fit your layout needs.
What is the best method for separating large datasets for analysis?

+
Grouping and outlining can be very effective for managing large datasets as it allows for an interactive view of your data, reducing visual clutter and focusing on key sections.
