Excel Sheets Organized: Tips and Tricks for Efficiency
Welcome to our comprehensive guide on mastering Excel for efficiency. Excel is not just a tool for number crunching; it’s a powerful platform for data organization, analysis, and productivity enhancement. By leveraging some of Excel’s lesser-known features and implementing a few simple strategies, you can transform your data handling experience from tedious to streamlined. Here’s how you can excel in Excel:
Organizing Data in Sheets

Freeze Panes and Split Windows: One of the foundational skills in Excel is managing how you view your data. The Freeze Panes feature lets you lock specific rows or columns in place while you scroll through the rest of your data. Here’s how to do it:
- Select the row below or the column to the right of where you want to freeze panes.
- Go to View > Freeze Panes.
- Choose either Freeze Panes, Freeze Top Row, or Freeze First Column depending on your need.
🧠 Note: Remember to unfreeze panes if you no longer need them; otherwise, it might confuse future users of your sheet.
Similarly, the Split Window feature allows you to split your sheet into separate panes for concurrent viewing:
- Click in the row or column where you want the split.
- Go to View > Split.
Table of Split and Freeze Options
| Option | Use Case |
|---|---|
| Freeze Panes | Keep headers or key rows/columns visible while scrolling |
| Split Window | View two different parts of your sheet at the same time |
Using these features can significantly reduce scrolling time, making data navigation more efficient.
Enhancing Data Entry with Smart Features

Excel offers several tools to streamline data entry:
- Data Validation: Prevent data entry errors by setting rules for what kind of data can be entered in a cell.
- Go to Data > Data Validation.
- Set your criteria under the Settings tab.
- AutoComplete and Flash Fill: Excel can predict and fill in repetitive entries or extract data from other cells.
- Start typing a cell, and Excel will suggest the rest if it recognizes the pattern.
- Use Flash Fill by beginning to fill out data in the way you want, then go to Data > Flash Fill or press Ctrl + E.
- Drop-down Lists: Create a list for users to select from, reducing typos and enforcing consistency.
- Use the Data Validation tool with the "List" option.
💡 Note: Regularly updating these lists ensures that your data remains current and relevant.
Analyzing Data with Formulas and Functions

Excel’s vast library of formulas and functions makes it an indispensable tool for data analysis:
- VLOOKUP, HLOOKUP, and XLOOKUP: These are lookup functions that search for values in a table and return corresponding values from another column or row.
- VLOOKUP for vertical searches, HLOOKUP for horizontal, and XLOOKUP which works both ways with enhanced features.
- Conditional Formulas: These allow you to make decisions based on data criteria:
- IF function to perform tests and return values accordingly.
- INDEX combined with MATCH can replace VLOOKUP with more flexibility.
- PivotTables: Summarize, analyze, explore, and present your data by dragging and dropping fields, making data interpretation visual and interactive.
Maximizing Productivity with Macros and Add-ins
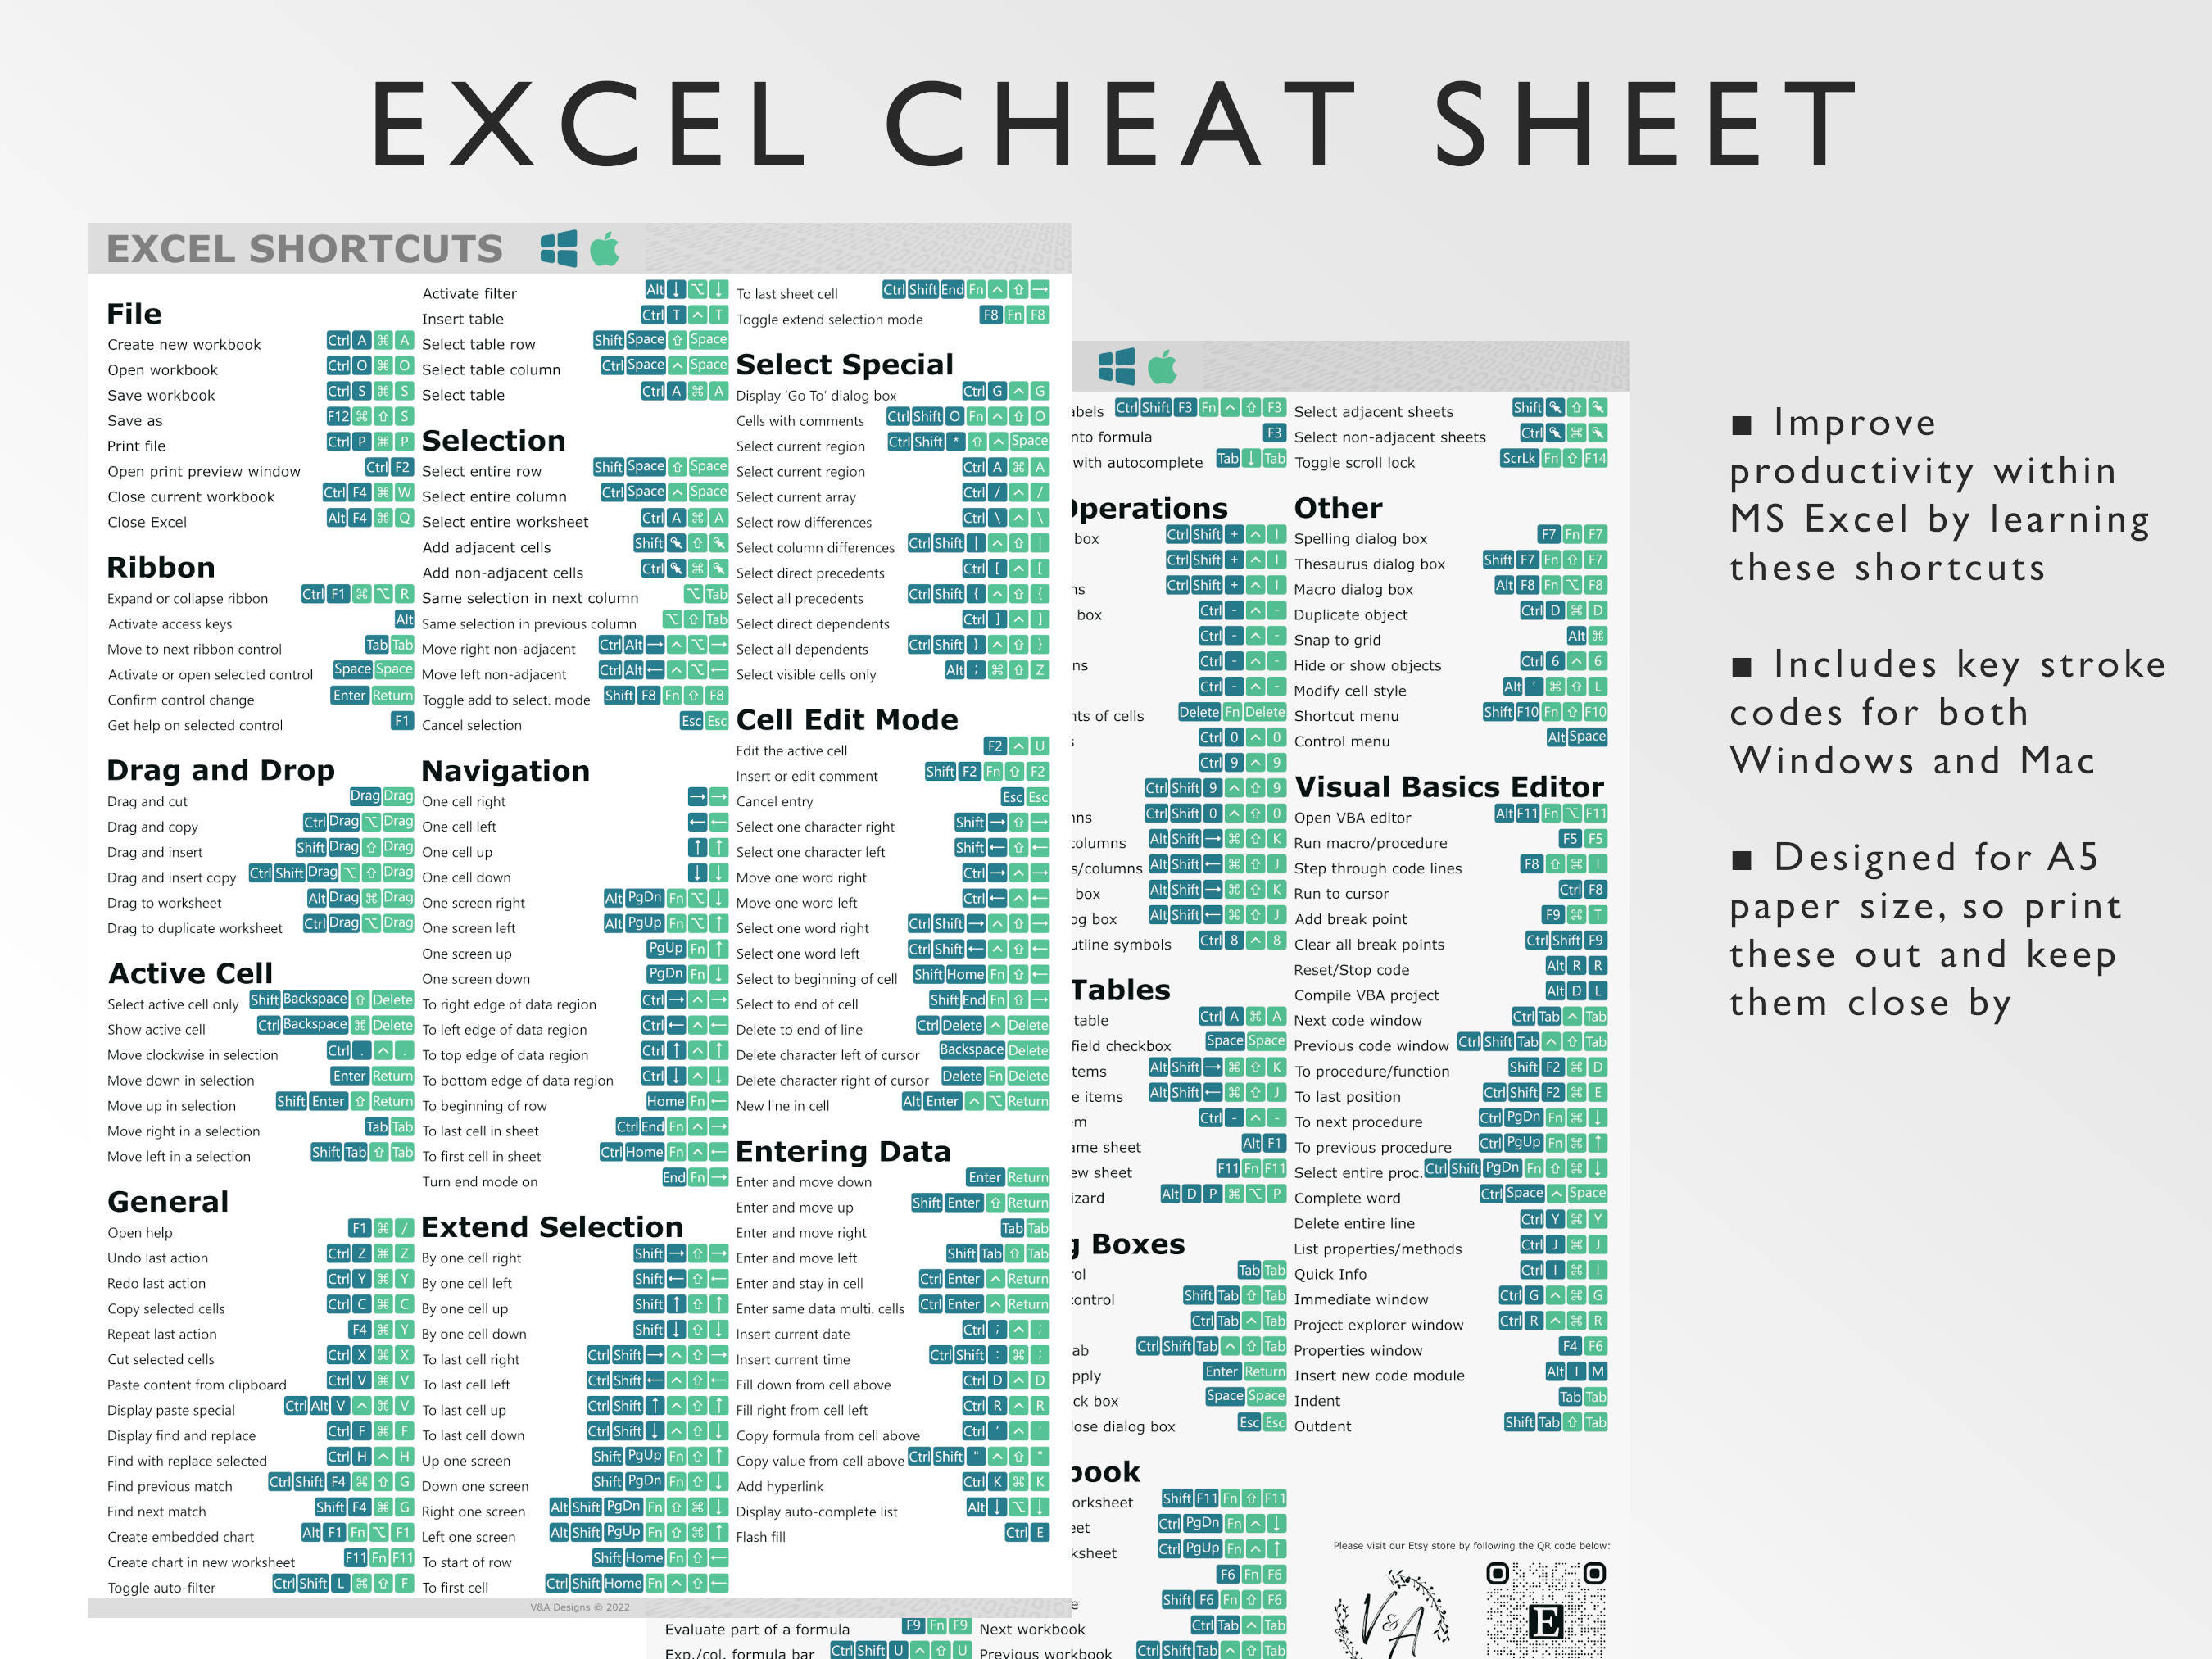
Take your efficiency to the next level with automation:
- Record Macros: Automate repetitive tasks with a simple click.
- Go to Developer tab > Record Macro, perform the task, then stop recording.
- VBA (Visual Basic for Applications): For more complex automation, write code in VBA.
- Excel Add-ins: Extend Excel's capabilities with tools like Solver for optimization or Analysis ToolPak for statistical analysis.
These tools can drastically cut down the time you spend on routine tasks, freeing you up for more strategic work.
Optimizing Excel for Better Performance

To ensure Excel runs smoothly with large datasets or complex calculations:
- Use Efficient Formulas: Opt for array formulas, SUMIFS instead of multiple SUMs, or AVERAGEIFS over averaging individual cells.
- Workbook Management:
- Break large workbooks into smaller ones.
- Use external references or data consolidation methods.
- Excel Options:
- Go to File > Options > Advanced and disable features not needed, like animations, to boost performance.
In our journey through Excel’s myriad features, we’ve touched on organizing data with features like Freeze Panes, enhancing data entry with validation and smart tools, analyzing data with complex formulas, automating tasks with macros, and optimizing performance. Each of these aspects contributes to a more efficient Excel experience. Remember, mastering Excel is about combining knowledge of these features with the regular practice of your unique workflow. Over time, these tips and tricks will become second nature, allowing you to wield Excel’s power with confidence and precision.
What’s the difference between VLOOKUP and XLOOKUP?
+
VLOOKUP searches vertically for a lookup value in the first column of a table and returns a value from the same row in another column. XLOOKUP is more versatile; it can search both vertically and horizontally, return multiple values, and handles arrays natively, making it the newer, more powerful alternative to VLOOKUP and HLOOKUP.
How do I create a drop-down list in Excel?
+
To create a drop-down list, you first need a list of items. Select the cell or range where you want the list, go to Data > Data Validation, choose “List” from the Allow: box, and enter your list into the Source field or select from existing data.
Can I automate Excel tasks without knowing VBA?

+
Yes, with Excel’s macro recorder, you can automate tasks without writing VBA code. Simply perform the task once while recording the macro, and Excel will repeat the process when you run the macro.


