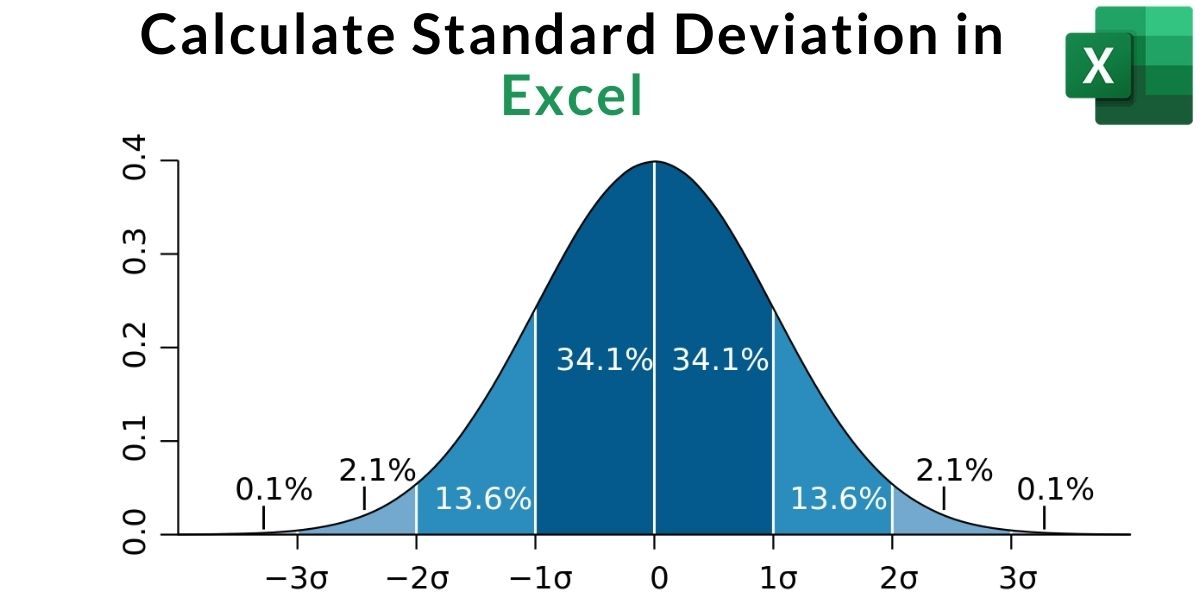
5 Easy Steps to Calculate Standard Deviation in Excel

Understanding statistical measures like standard deviation is crucial for various fields ranging from finance to social sciences. Excel, with its robust set of functions, offers an efficient way to calculate standard deviation. Here's how you can easily compute it using this versatile software.
Step 1: Prepare Your Data

Before calculating the standard deviation, ensure your data is organized:
- Enter your data into a single column or row. This will be your sample dataset.
- If you have headers or labels, they should be placed in a separate row or column to avoid inclusion in the calculation.
- Check for any missing values, as these can skew your results.
Step 2: Select Your Calculation Method

Excel provides multiple functions for standard deviation:
- STDEV.S or STDEV: Use these for a sample standard deviation where the data you have is a sample of a larger population.
- STDEV.P or STDEVP: Choose these for calculating the population standard deviation when your dataset represents the entire population.
Decide which one to use based on whether your data represents the whole population or just a sample.
Step 3: Calculate Standard Deviation

Here’s how to use Excel to calculate standard deviation:
- Choose an empty cell where you want the result to appear.
- Type in the function name, e.g., =STDEV.S() or =STDEV.P().
- Inside the parentheses, select the range of your data. For example, if your data is from A2 to A10, type A2:A10.
- Press Enter and Excel will display the standard deviation for your dataset.
⚠️ Note: Make sure to use the correct function depending on whether you're working with a sample or the entire population to avoid misinterpreting your results.
Step 4: Interpretation and Presentation

Once you’ve calculated the standard deviation, here’s what you can do with the result:
- Compare it with other datasets to understand variability.
- Visualize the data using charts like box plots or histograms where the standard deviation can be represented visually.
- Document and report your findings clearly, explaining the implications of the standard deviation value in context.
Step 5: Troubleshooting Common Errors

Here are a few common issues you might encounter and how to resolve them:
- #DIV/0! Error: This occurs when the selected range contains no valid numerical data or all data is the same, leading to a standard deviation of zero.
- #NUM! Error: This happens if there are logical errors in the calculation process or if you’re using an older version of Excel with functions that are no longer supported.
📚 Note: To avoid errors, ensure your data includes at least two values, and they are all numbers.
By following these steps, you can quickly analyze the variability of your data sets using Excel, providing insights into the spread of your data. Whether for academic purposes, business analysis, or personal projects, understanding how to calculate and interpret standard deviation in Excel will enhance your data analysis capabilities. While these steps are straightforward, always double-check your data for accuracy and ensure you're selecting the right statistical function for your needs to yield meaningful results.
What is the difference between STDEV.S and STDEV.P?

+
STDEV.S calculates the sample standard deviation, assuming your data represents a sample of the population. STDEV.P computes the population standard deviation when your dataset includes the entire population. The difference lies in the formula used; STDEV.S divides by (n-1), whereas STDEV.P divides by n, where n is the number of data points.
Why should I use standard deviation in data analysis?

+
Standard deviation is a measure of how spread out the numbers in a dataset are. It helps in understanding the consistency or variability of the data points, which is essential for making inferences about the data, assessing risk, comparing datasets, or evaluating the reliability of results in experiments.
How can I visualize the standard deviation in Excel?

+
Excel allows you to visualize standard deviation using various charts like histograms with error bars, box and whisker plots, or by adding standard deviation lines to scatter or line charts. You can adjust chart settings to display the mean, median, and standard deviation for a clearer view of data distribution.
What are some common mistakes when calculating standard deviation?

+
Common mistakes include: including non-numeric data, ignoring blank cells or zero values, using the wrong function for sample or population data, and not considering outliers which can significantly affect the standard deviation.