Create a Simple Stock Balance Sheet in Excel

In the fast-paced world of business, maintaining accurate records of your inventory and stock is crucial. Whether you're running a small startup or managing a large corporation, keeping an eye on your stock levels ensures you can meet customer demand efficiently while minimizing waste from overstocking. One of the most effective tools for this purpose is Microsoft Excel, a versatile spreadsheet application that can be used to create a straightforward and powerful stock balance sheet. Let's delve into how you can create a simple stock balance sheet in Excel to streamline your inventory management.
Understanding the Basics of a Stock Balance Sheet

A stock balance sheet in Excel helps businesses track quantities of products in stock, monitor stock movement, and understand their inventory turnover rates. Here’s what you need to know before we start:
- Stock in Hand: The current inventory level at any given time.
- Stock Purchased: The amount of stock acquired within a period.
- Stock Sold: The inventory that has been sold or distributed.
- Balance Stock: The remaining stock after accounting for purchases and sales.
Setting Up Your Excel Sheet

Here are the steps to create a simple stock balance sheet:
1. Launch Excel and Set Up Your Spreadsheet

Open Microsoft Excel. In a new spreadsheet, set up the following columns:
| Column A | Column B | Column C | Column D | Column E |
|---|---|---|---|---|
| Item | Initial Stock | Stock Purchased | Stock Sold | Stock Balance |

2. Entering Data
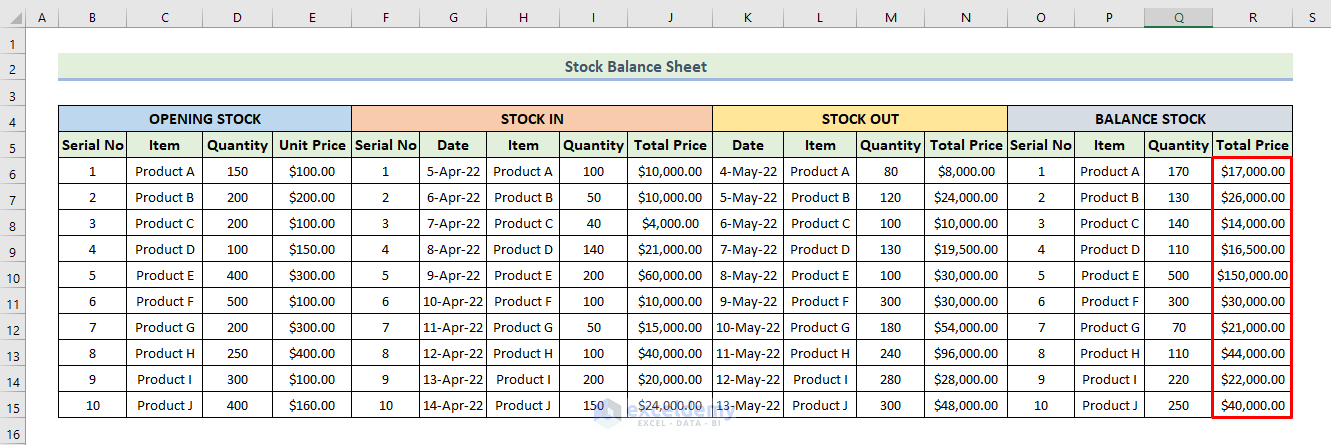
List all your items in the ‘Item’ column. Next to each item, input the initial stock count. Here’s how you can proceed:
- Initial Stock: Enter the number of units in stock at the beginning of the period.
- Stock Purchased: Record the amount of stock purchased during this period.
- Stock Sold: Note the quantity of each item sold or distributed.
📝 Note: Ensure your entries are accurate; even a small error can skew your entire inventory balance.
3. Calculating Stock Balance

To compute the balance for each item, you’ll use the formula:
Initial Stock + Stock Purchased - Stock Sold = Stock Balance
In Excel, enter the formula for the first item's stock balance in Column E like this:
=B2+C2-D2
Then, drag this formula down to fill the entire 'Stock Balance' column for all items. Excel will adjust the cell references automatically.
4. Data Validation and Error Checking

Use Excel’s data validation feature to ensure that:
- No negative stock values are entered.
- Stock sold does not exceed stock on hand plus stock purchased.
🔍 Note: Data validation can prevent many common errors in data entry.
5. Formatting and Reporting

Customize your spreadsheet to enhance readability and usability:
- Format numbers: Use the ‘Number’ format to ensure all quantities are correctly formatted.
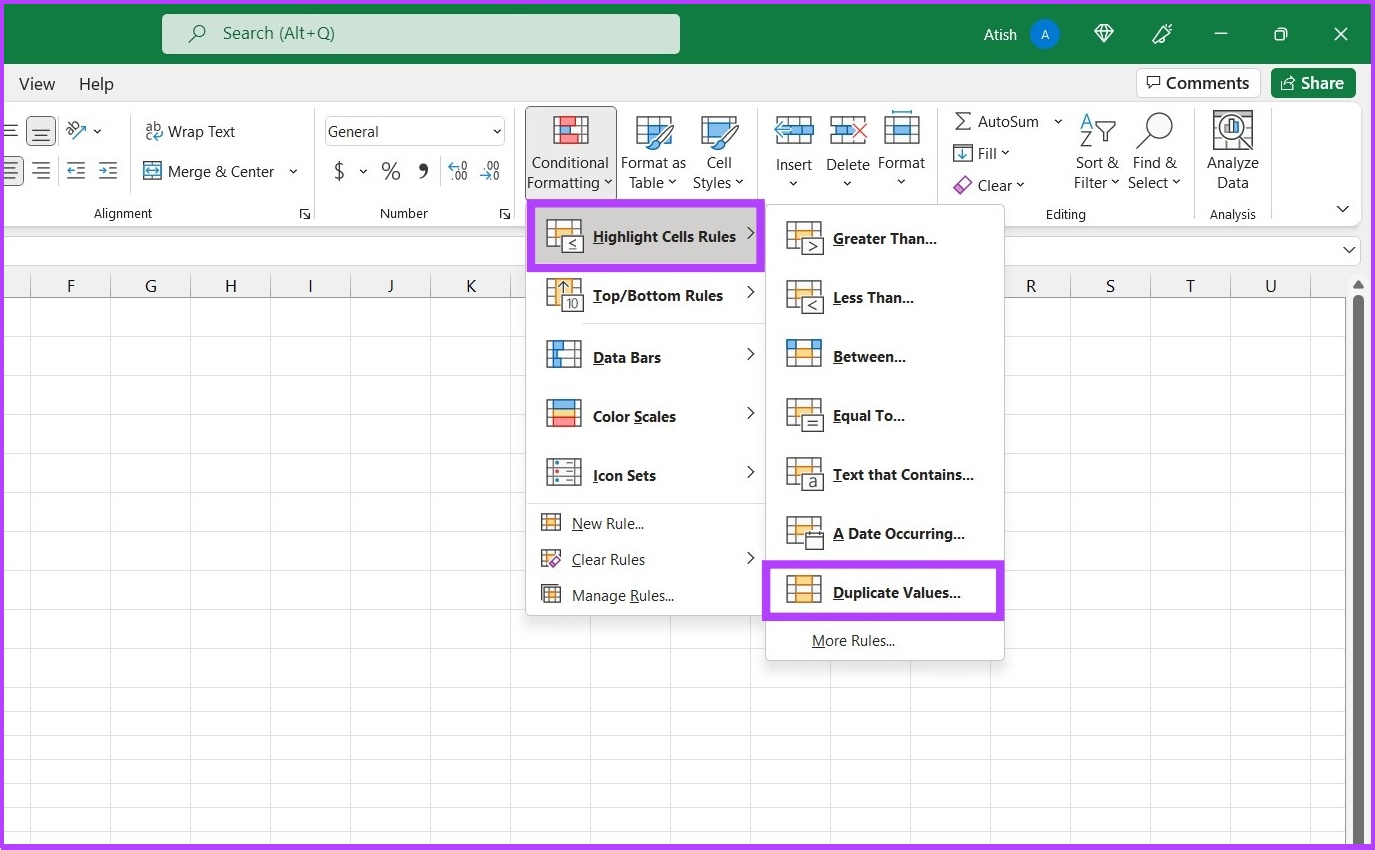
- Conditional Formatting: You might set up conditional formatting to highlight low stock levels or items that need restocking.
- Sort and Filter: Use sorting and filtering to manage data more effectively.
Advanced Features to Enhance Your Stock Balance Sheet
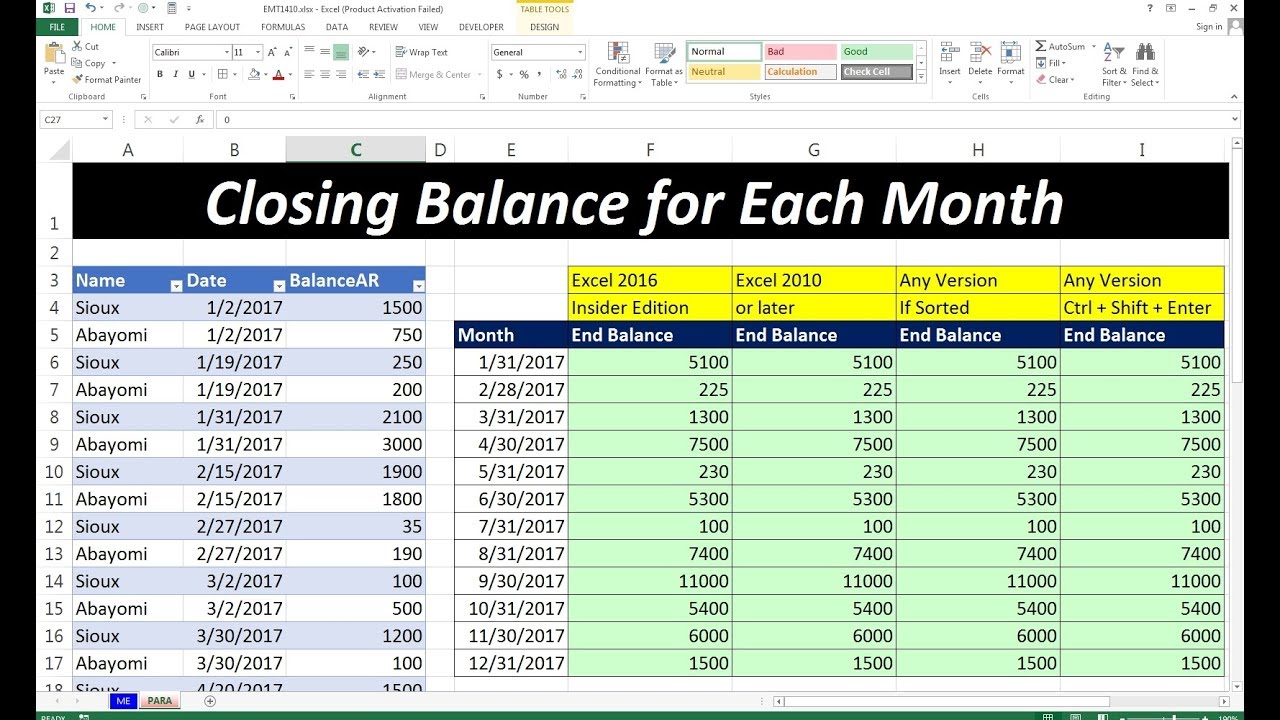
Once you’re familiar with the basic setup, you can leverage Excel’s advanced features:
Automatic Updates with Macros

Create macros to:
- Automate the process of calculating stock balance.
- Update stock levels when new stock is purchased or items are sold.
🤖 Note: Macros can save time and reduce manual errors, but they require some VBA (Visual Basic for Applications) knowledge.
Pivot Tables for Analysis

Use pivot tables to analyze:
- Sales trends over time.
- Stock levels by category or supplier.
- Turnover rates for different items.
Data Visualization
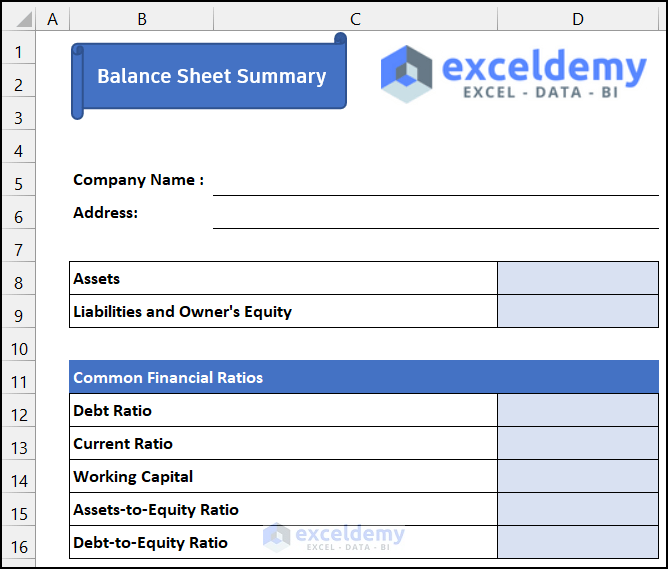
Excel’s charting tools can:
- Create graphs to visualize stock levels.
- Track sales performance.
By enhancing your stock balance sheet with these features, you can get actionable insights from your inventory data.
In conclusion, a well-managed stock balance sheet in Excel can significantly improve your inventory control. It helps in avoiding both overstocking, which ties up capital, and understocking, which can lead to missed sales opportunities. By following the steps outlined above, you can create a robust system to manage your inventory effectively. Remember, the key is consistency in data entry and regular updates to reflect real-time inventory changes. With practice, you'll not only manage your stock better but also gain insights into trends and patterns in your business operations that can drive strategic decisions.
Can I track stock movement across multiple locations?

+
Yes, Excel supports this through the use of pivot tables or separate sheets for each location. You can consolidate data from these sheets into a master sheet for an overview.
How often should I update my stock balance sheet?
+
It’s best to update your stock balance sheet daily or at least weekly, especially if your business involves frequent stock movement. Regular updates ensure your records are accurate.
What if I have returns in my stock?
+Add a ‘Returns’ column to account for stock returns. Your balance formula would then be: Initial Stock + Stock Purchased - Stock Sold + Returns = Stock Balance.
Can Excel handle stock tracking for perishable goods?
+Yes, but you’ll need to incorporate expiration dates and possibly use conditional formatting to alert when stock is nearing its expiration date.
How do I ensure data security in my stock balance sheet?
+Regularly backup your data, use password protection on Excel files, and consider implementing access controls if the sheet is shared across a network or cloud services.

