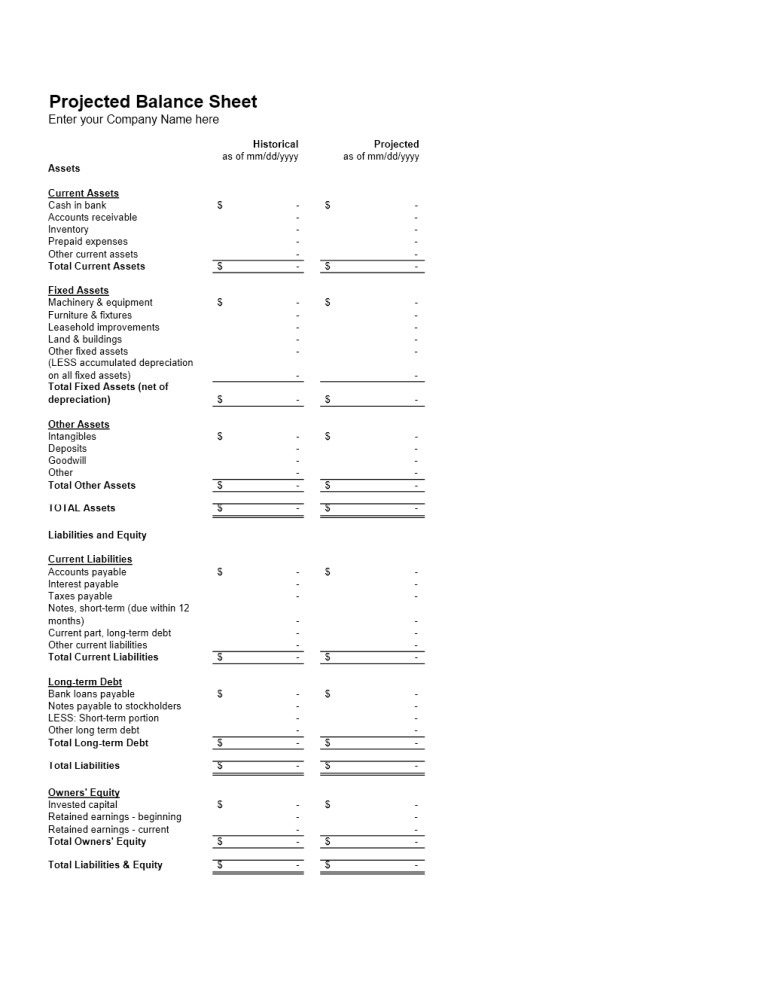
Creating a Projected Balance Sheet in Excel Easily

In today's fast-paced business environment, being able to project future financial health is a cornerstone of strategic planning. Whether you're a business owner, financial analyst, or just someone looking to understand your financial future, learning how to create a projected balance sheet in Excel can provide invaluable insights. Here's how you can craft one easily and effectively.
What is a Projected Balance Sheet?

A projected balance sheet, or pro forma balance sheet, is a financial statement that estimates an entity's future financial position over a specified period. It helps in:
- Evaluating the company’s future liquidity
- Assessing solvency
- Predicting financial stability
Setting Up Your Spreadsheet

Start by opening a new Excel workbook. Here are the steps:
- Create Headers: In the first row, label columns A to D with "Item", "Previous Year", "Current Year", and "Projected Year".
- List Financial Items: Under the "Item" column, list all balance sheet items starting from assets (e.g., Cash, Accounts Receivable), liabilities (e.g., Accounts Payable, Long-term Debt), to equity (e.g., Retained Earnings, Common Stock).
Entering Initial Data

Input the figures for the previous year and the current year:
- Previous Year: These numbers come from your last balance sheet.
- Current Year: This data can be either actuals or estimates if the year is not complete.
| Item | Previous Year | Current Year | Projected Year |
|---|---|---|---|
| Cash | 10,000 | 15,000 | |
| Accounts Receivable | 5,000 | 7,500 | |
| Inventory | 8,000 | 9,000 |

💡 Note: Ensure all numbers are consistent in terms of currency and scale (e.g., thousands, millions).
Projecting Future Figures

To project the figures for the upcoming year:
- Calculate Growth Rates: Use a formula to calculate the growth rate between the previous and current year for each item. For example: =(Current Year Value / Previous Year Value) - 1.
- Apply Growth Rates: Multiply the current year's figures by these growth rates to estimate the projected year's numbers.
Example:
- If Cash grew by 50% from last year, you might project: =B2*(1 + C2) to get the projected cash value.
Finalizing the Balance Sheet

After projecting your figures:
- Check for Balances: Ensure Assets = Liabilities + Equity. You might need to make adjustments or verify data integrity.
- Use Formulas for Summary Lines: Add formulas to calculate totals for Asset, Liability, and Equity sections.
- Format for Clarity: Use formatting options in Excel to distinguish between different sections, highlight key figures, or use conditional formatting to show increases or decreases in value.
💡 Note: Regularly update your balance sheet to reflect actuals as they become available to refine your projections.
Best Practices

- Keep formulas simple but effective.
- Regularly review and update your growth assumptions based on actual performance.
- Use data validation and named ranges for easier updates and consistency.
Creating a projected balance sheet in Excel provides a clear financial forecast, assisting in strategic decision-making. By analyzing historical data, applying growth rates, and utilizing Excel’s robust tools, you can visualize your company’s potential financial state in the coming year. This process not only informs strategy but also prepares you for various financial scenarios, making your business more adaptable and forward-looking.
What is the difference between actual and projected balance sheets?

+
An actual balance sheet shows the real financial position at a specific point in time, while a projected balance sheet forecasts future financial health based on assumptions.
Can I use this method for long-term projections?

+
Yes, but long-term projections require more complex assumptions and adjustments for potential economic or industry changes.
How often should I update my projections?

+
It’s advisable to update projections quarterly or whenever there’s a significant change in business operations or external factors affecting finances.


