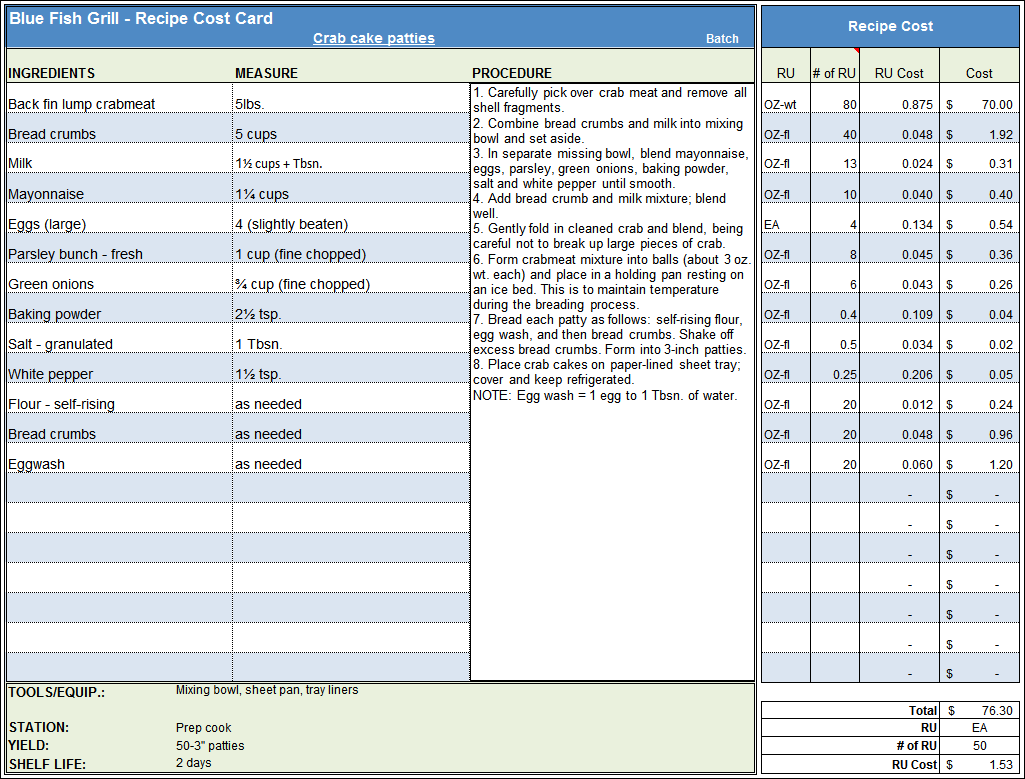
Excel Costing Sheet: Step-by-Step Creation Guide

Creating a costing sheet in Excel is an essential task for businesses looking to track expenses, manage budgets, and analyze costs effectively. This guide will walk you through the process of creating a comprehensive costing sheet from scratch, ensuring you cover all aspects of your business operations.
Understanding the Basics of Costing

Before diving into Excel, it’s crucial to understand the fundamental elements of costing:
- Direct Costs: These are expenses that directly tie to the production of goods or services, like raw materials or labor.
- Indirect Costs: Costs that aren’t directly linked to production but are necessary for operations, such as utilities or rent.
- Fixed Costs: Expenses that do not change with production levels, like lease payments or administrative salaries.
- Variable Costs: These costs vary with production volume, including materials and direct labor.
Setting Up Your Excel Worksheet

Here’s how you can set up your Excel worksheet for a costing sheet:
1. Create the Spreadsheet

Open Excel and create a new workbook:
- Label columns appropriately like ‘Item’, ‘Unit Cost’, ‘Quantity’, ‘Total Cost’, etc.
- Use headers and merge cells where necessary for clarity.
- Highlight or format cells to categorize direct, indirect, fixed, and variable costs for easy reading.
2. Inputting Data

Fill in your data:
- Enter each item or cost element into rows, with corresponding information in the columns.
- Use conditional formatting to highlight critical data or potential issues, like costs exceeding budget.
✏️ Note: Make sure to double-check the accuracy of the entered data, as errors can lead to inaccurate costing calculations.
3. Formulas for Automatic Calculations

Here are some essential formulas:
- Total Cost: = [Unit Cost] * [Quantity]
- Total Direct Costs: Use the SUM function to add up all direct costs.
- Total Indirect Costs: Similarly, sum up all indirect costs.
- Gross Margin: = [Revenue] - [Total Direct Costs] / [Revenue]
Below is a simple example of how you might structure your Excel sheet:
| Item | Unit Cost | Quantity | Total Cost |
|---|---|---|---|
| Widget A | $10 | 50 | =B2*C2 |
| Widget B | $5 | 100 | =B3*C3 |
| Total Direct Costs: | =SUM(D2:D3) |

Advanced Excel Features for Cost Analysis

1. Data Validation

- Use data validation to limit what users can enter into certain cells to ensure accuracy.
2. Pivot Tables

- Pivot tables can help summarize and analyze cost data efficiently.
3. Conditional Formatting

- This feature can highlight cells that meet specific criteria, like costs exceeding budget or low inventory levels.
🧠 Note: Use pivot tables to analyze trends and patterns in your cost data over time, which can aid in strategic decision-making.
Summarize Key Points

In the journey to create an effective costing sheet in Excel, we’ve covered setting up your spreadsheet, entering accurate data, and using formulas to automatically calculate costs. We’ve also introduced advanced features like data validation, pivot tables, and conditional formatting to enhance your cost analysis capabilities. Remember that accurate data entry and regular updates are key to maintaining a valuable costing tool. With these steps, you now have the foundation to manage your business expenses with precision and insight, enabling better decision-making, cost control, and ultimately, the opportunity to boost your bottom line.
What is the difference between direct and indirect costs?

+
Direct costs are expenses that can be directly attributed to the production of goods or services, like raw materials or direct labor. Indirect costs are expenses that are not directly tied to production but are necessary for business operations, such as rent or utilities.
How do I handle fixed and variable costs in Excel?

+
Fixed costs can be entered as a one-time or monthly amount in the spreadsheet, while variable costs can be calculated using formulas based on production or sales volume. For instance, multiply the unit cost by the quantity to get the total variable cost for each item.
Why should I use pivot tables for cost analysis?

+
Pivot tables allow you to quickly summarize large datasets, analyze costs by category or over time, and provide visual insights into cost trends and variances. They are powerful tools for making data-driven decisions.
What if my costs exceed my budget?

+
Use conditional formatting to highlight costs that exceed budgeted amounts. This visual cue can prompt you to investigate and adjust your operations or budget accordingly to maintain financial control.
Can I share my costing sheet with others?
+Yes, you can share your Excel costing sheet through various methods, including email attachments, cloud storage like OneDrive or Google Drive, or even as part of an Excel Online workbook for real-time collaboration.


