5 Easy Steps to Create a Chart Sheet in Excel

Creating a chart sheet in Microsoft Excel can transform complex data into visual representations that are easier to understand and analyze. Whether you're a business analyst, a student, or simply someone looking to organize data effectively, this guide will help you through the process of creating an informative chart sheet in Excel with ease.
Step 1: Prepare Your Data

The first step to creating a chart sheet is to ensure your data is clean and organized:
- Check for missing or erroneous data.
- Organize your data in a tabular format with headers for each column.
- Ensure that your data series and categories are properly labeled.
Step 2: Select Your Data

Highlight the data you wish to include in your chart:
- Click and drag your cursor over the cells containing the data.
- For non-contiguous cells, hold down the Ctrl key while selecting.
📝 Note: Ensure your data range does not include empty rows or columns as this can cause your chart to display incorrectly.
Step 3: Insert the Chart

Navigate to the 'Insert' tab on the Excel ribbon:
- Select the chart type that best suits your data presentation needs from the 'Charts' section.
- Click on your desired chart, and it will appear on the existing worksheet.
Step 4: Create a New Chart Sheet

After inserting the chart:
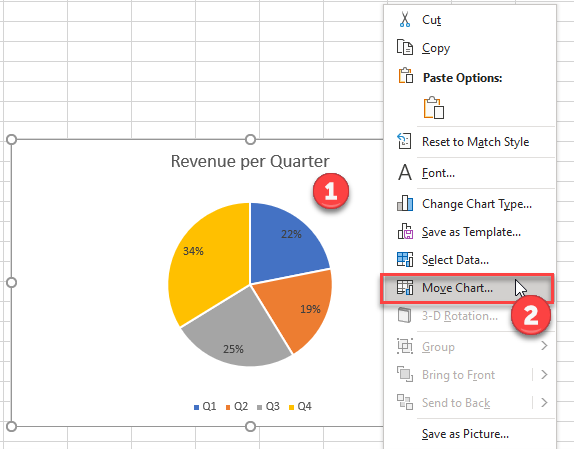
- Right-click on the chart and choose 'Move Chart'.
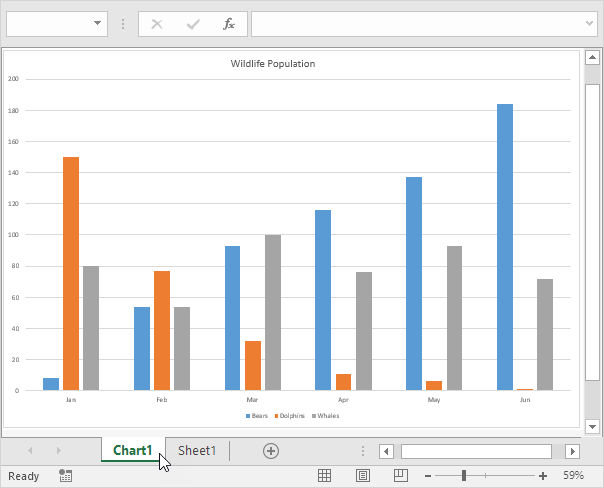
- In the dialog box, select 'New sheet' and optionally rename the sheet to something meaningful like 'Sales Overview'.
🛠️ Note: You can always move the chart back to the original worksheet if needed, offering flexibility in presentation.
Step 5: Customize Your Chart

With your chart on its own sheet, you can now refine it:
- Click on the chart to activate the 'Chart Tools' options at the top, where you'll find 'Design', 'Layout', and 'Format' tabs.
- Use these tools to change chart styles, add titles, labels, legends, and adjust color schemes.
- Consider using 'Recommended Charts' for automatic suggestions on the best chart type for your data.
In this guide, we've covered the fundamental steps to create a chart sheet in Excel. From data preparation to chart customization, you now have the tools to visually represent your data effectively. This process not only enhances the aesthetics of your data but also makes it more accessible and understandable for anyone viewing your Excel workbook.
What are the benefits of using a chart sheet in Excel?

+
Using a chart sheet allows for dedicated space to display data visually, making it easier for viewers to focus on the chart without distractions from surrounding data. It also simplifies the chart’s customization and printing process.
Can I move my chart back to the original worksheet if needed?

+
Yes, you can easily move your chart back to the original or any other worksheet by selecting ‘Move Chart’ from the chart’s context menu and choosing the desired location.
What types of charts are recommended for different data?

+
Here’s a quick guide:
- Bar/Column charts for comparing categories.
- Line charts for showing trends over time.
- Pie charts for displaying parts of a whole.
- Scatter plots for finding relationships between two variables.


