5 Simple Steps to Create an Excel Data Sheet

Understanding the Basics of Excel

Before diving into the practical steps for creating an Excel data sheet, let’s briefly explore what Microsoft Excel is and why it’s considered an invaluable tool in data management and analysis. Microsoft Excel is part of the Microsoft Office suite, primarily used for organizing, analyzing, and storing data in tabular form. Excel provides a grid interface, which makes it intuitive for users to input data, perform calculations, and generate charts or graphs from the data entered.
Excel excels in several areas:
- Data Entry: Input numerical or textual information into cells, which are organized into rows and columns.
- Calculation: Perform arithmetic operations and complex formulas for data analysis.
- Charting: Visualize data through various chart types like bar, pie, line, and more.
- Data Manipulation: Sort, filter, and pivot data to summarize and analyze information more effectively.
With this foundation in mind, we can now proceed to our step-by-step guide.
Step 1: Open Microsoft Excel and Start a New Workbook

Launch Microsoft Excel from your computer, either through the start menu or by locating its shortcut icon if installed on your desktop. On the welcome screen, click on “Blank Workbook” to open a new document. This action opens a blank workbook with multiple sheets where you can start your data entry.
💡 Note: A workbook in Excel can contain one or more sheets. By default, you get three sheets named Sheet1, Sheet2, and Sheet3.
Step 2: Set Up Your Spreadsheet

To begin, let’s set up the spreadsheet for data entry:
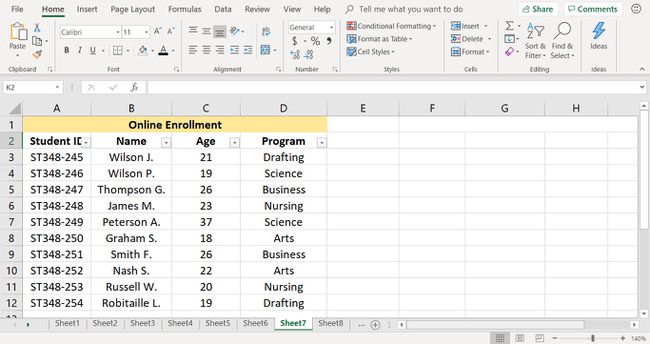
- Name Columns: Click on the cell in the first row where you want to label your columns. Enter your header titles here. For instance, if you’re managing sales data, you might label columns as “Product Name,” “Units Sold,” “Price per Unit,” etc.
- Format Headers: Select the header row, right-click, and choose “Format Cells.” You can change the font, make it bold or underlined, and even apply background colors to make headers visually distinct.
Step 3: Entering Data

With your structure in place, here’s how to enter the data:
- Input: Click on the cell where you want to enter data. Type in your information. For numerical data, Excel will align the entry to the right, while text aligns to the left.
- Auto-Fill: If you need to enter a series of values or copy a formula, drag the small square handle (Fill Handle) at the bottom-right corner of the cell to fill data into adjacent cells.
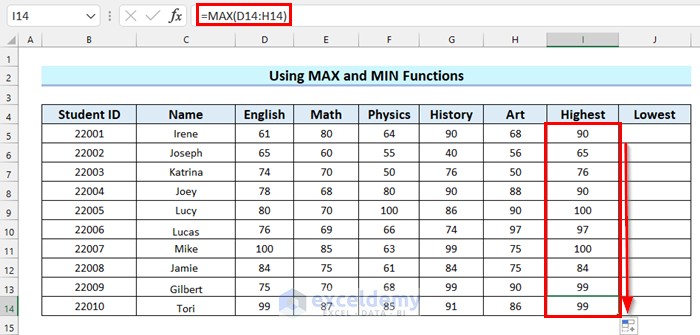
- Use Formulas: If you’re calculating sums, averages, or other computations, click on a cell, type an equal sign (=), and then enter your formula. Common formulas include:
=SUM(A2:A10)- to sum values in cells from A2 to A10=AVERAGE(B2:B10)- to calculate the average of values in cells B2 to B10
Step 4: Organizing and Manipulating Data

Excel shines with its data organization capabilities:
- Sorting: Select the range of data or entire columns and use the “Sort” feature from the “Data” tab to sort data alphabetically, numerically, or by date.
- Filtering: Enable filtering by clicking the “Filter” button in the “Data” tab. This adds filter dropdowns to each column header, allowing you to view only specific data rows.
- Conditional Formatting: From the “Home” tab, use “Conditional Formatting” to highlight cells that meet certain criteria, which can help in identifying trends or outliers visually.
Step 5: Analyzing Your Data

After inputting and organizing your data, use Excel’s built-in tools for analysis:
- Charts and Graphs: Select your data, then go to the “Insert” tab to choose from various chart options like column, pie, or line charts, helping to visualize trends, comparisons, or data distribution.
- PivotTables: For advanced analysis, create a PivotTable by selecting your data and clicking on “PivotTable” in the “Insert” tab. PivotTables are powerful for summarizing, exploring, and analyzing data interactively.
- Formulas and Functions: Explore Excel’s vast library of functions like VLOOKUP, INDEX-MATCH, IF statements, and many more to perform complex calculations or conditional logic.
Now that we've gone through the steps to create and manage an Excel data sheet, it's important to mention a few best practices. Regularly save your work, especially when dealing with large datasets. Use data validation to control the type of data or values that users enter into cells. Also, consider password protecting or encrypting sensitive data sheets.
In addition, Excel offers features like "Freeze Panes" to keep headers visible while scrolling through data, and "Name Manager" to name ranges for easier formula construction. Employing these features enhances the usability and accuracy of your data sheets.
The final point of our journey through creating an Excel data sheet has been reached. We've covered the basics, set up our worksheet, input and organized our data, and analyzed it for insights. Excel, with its myriad of tools and functionalities, empowers users to manage, analyze, and visualize data efficiently. Whether for personal budgeting, business inventory, or large-scale data analysis, Excel's simplicity and power make it an indispensable tool in modern data management.
Can I share my Excel file with others?

+
Yes, you can share your Excel file via email, cloud services like OneDrive or Google Drive, or use Excel’s sharing features to collaborate in real-time.
What if my data exceeds the Excel column or row limits?

+
Excel has limits for the number of rows and columns it can handle. For very large datasets, you might need to split your data into multiple sheets or use a different tool designed for big data.
How do I ensure data security in Excel?

+
Use features like password protection, encrypting the workbook, and setting permissions for different users to secure your data. Regular backups are also advisable.


