Insert a Chart in Another Sheet in Excel: Easy Guide

Discovering how to organize and manage data in spreadsheets is a key skill in today's digital workspace. Microsoft Excel, being a titan of data management, offers a range of tools for just that purpose. Among these is the ability to insert charts into different sheets to enhance data visualization and analysis, making your work not only more efficient but also much more insightful. In this guide, we'll walk through the steps to create and insert charts into another worksheet, making your data presentations seamless and professional.
Understanding Excel Sheets and Charts

Before diving into the how-to, let's clarify what we mean by "sheets" and "charts" in Excel:
- Sheets: Think of these as individual pages within an Excel workbook, where each sheet can contain data and different types of content.
- Charts: These are graphical representations of your data, bringing visual clarity to numbers and patterns that might be missed in tabular form.
Steps to Create and Insert Charts in Another Sheet

1. Selecting the Data for Your Chart

The first step in creating a chart is to select the relevant data:
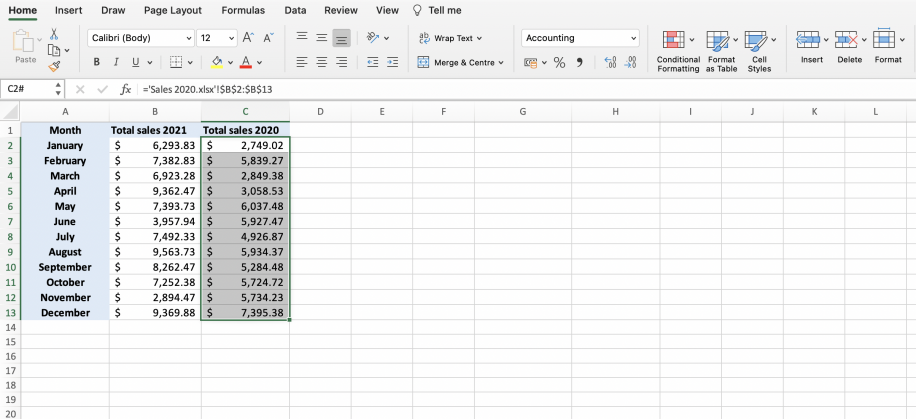
- Click and drag to highlight the data you wish to visualize. This can be a range of cells containing numbers, text, dates, or any other data type.
2. Creating the Chart

With your data selected:
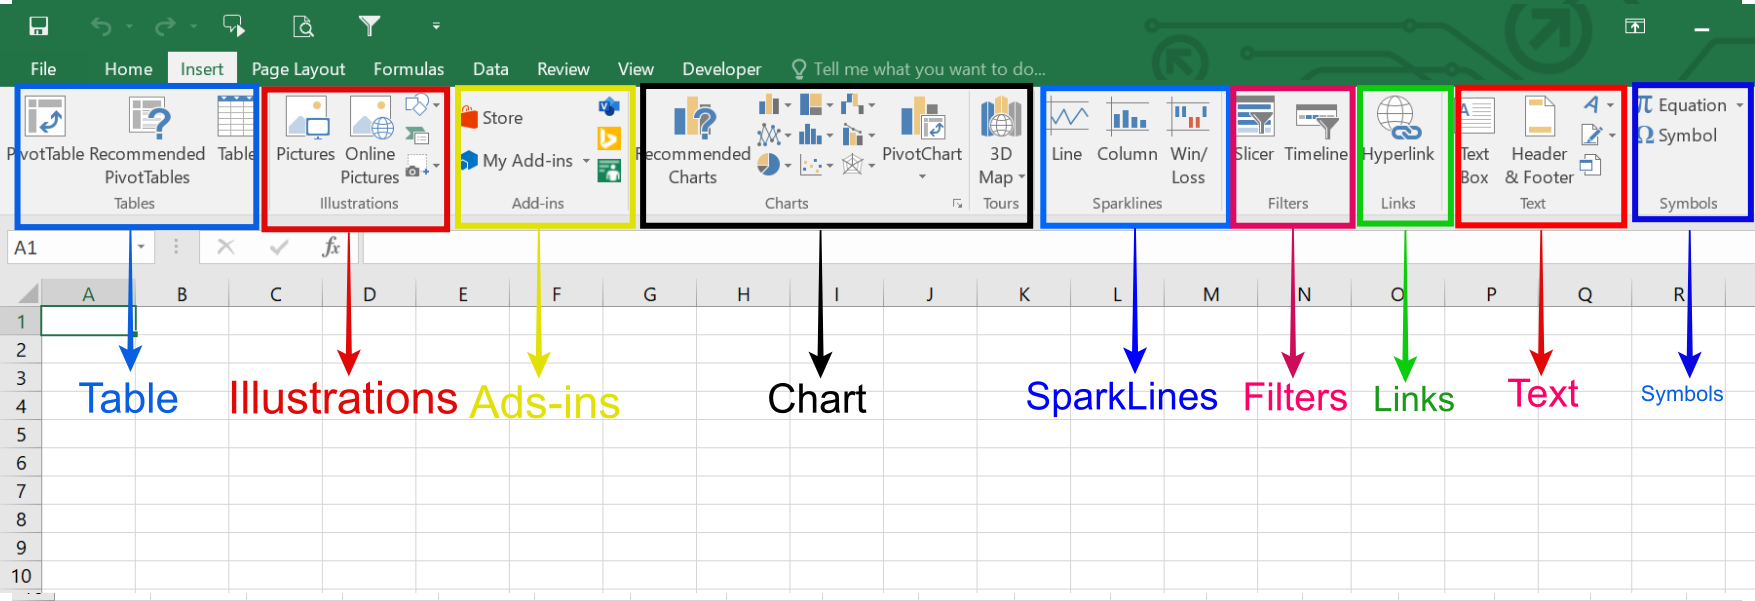
- Go to the Insert tab on the Excel ribbon.
- Choose the type of chart you need from the chart gallery (Column, Line, Pie, Bar, etc.).
- Excel will then insert the chart into the current sheet where your data resides.
3. Moving the Chart to Another Sheet

To relocate your chart:
- Click on the chart to select it.
- Go to the Design tab under Chart Tools.
- Click on Move Chart. A dialog box will appear.
- Under “Choose where you want the chart to be placed,” select New sheet or Object in. If choosing a new sheet, name it appropriately. If you select Object in, pick an existing sheet from the dropdown.
- Click OK, and your chart will move to the new or specified sheet.
| Step | Description |
|---|---|
| Select Data | Highlight your data range. |
| Insert Chart | Use the Insert tab to add a chart. |
| Move Chart | Use Design > Move Chart to relocate. |

📌 Note: Ensure your selected data range does not include unnecessary rows or columns to avoid distorting the chart representation.
4. Editing Chart Properties in the New Sheet

Once your chart is in its new home:
- You can adjust the chart’s size, style, color, and many other properties directly on this sheet.
- Right-click on the chart and choose Format Chart Area for more detailed customization.
💡 Note: Changes made to the chart in the new sheet will not affect the original data on the source sheet.
Tips for Enhancing Your Excel Charts

- Data Labels and Legend: Use data labels to clarify the value each chart element represents, and a legend to denote what each color or symbol stands for.
- Consistent Formatting: Maintain uniform formatting across your charts to ensure consistency in your presentation.
- Chart Titles: Add meaningful titles that clearly state what the chart is depicting.
- Axis Formatting: Customize axis labels, ticks, and scales for readability and clarity.
In wrapping up, mastering the technique of inserting charts into other sheets in Excel not only streamlines your workflow but also enhances your data presentation. You’ve learned how to select data, create charts, relocate them, and even tweak the charts for better visualization. Remember that your charts are more than just pretty pictures; they’re tools to uncover insights and trends that numbers alone might obscure. Whether you’re sharing data within your team or presenting to stakeholders, using well-placed charts can significantly elevate your data analysis and communication prowess.
Can I link my chart back to the source data in Excel?

+
Yes, when you move a chart, it remains linked to the source data. Any changes you make to the data will automatically update the chart, provided the chart wasn’t manually disconnected from the data.
What should I do if my chart is not updating with new data?

+
Ensure the data range of your chart is set to include any new rows or columns added. You can adjust the range in the Select Data Source dialog box available under the Design tab for your chart.
Can I insert multiple charts into one sheet?

+
Yes, you can create multiple charts within the same sheet or move them to different sheets as needed. This allows you to compartmentalize data analysis for a cleaner presentation.
Now that you know how to insert charts into different sheets, you’re equipped to handle data in Excel like a pro, making your data stories more compelling and impactful.


