Excel
Find Critical Value In Excel

Understanding Critical Values in Statistics

Critical values are an essential concept in statistical hypothesis testing, used to determine whether a result is statistically significant. In essence, a critical value is a threshold value that a test statistic must exceed to reject the null hypothesis. The critical value depends on the chosen significance level (usually denoted as α) and the degrees of freedom associated with the test. In this post, we will explore how to find critical values in Excel, a widely used spreadsheet software that can handle various statistical calculations.
Why Use Excel for Finding Critical Values?

Excel is a versatile tool that offers several advantages for statistical calculations, including the ability to find critical values. It provides functions for calculating critical values for various distributions, such as the standard normal distribution (Z-distribution), t-distribution, chi-square distribution, and F-distribution. These functions are invaluable for hypothesis testing and confidence interval construction. Furthermore, Excel’s graphical capabilities and ease of data manipulation make it an excellent choice for statistical analysis.
Functions for Finding Critical Values in Excel

Excel offers several built-in functions for calculating critical values, each corresponding to a specific statistical distribution. The key functions are: - Z-distribution (Standard Normal Distribution): The
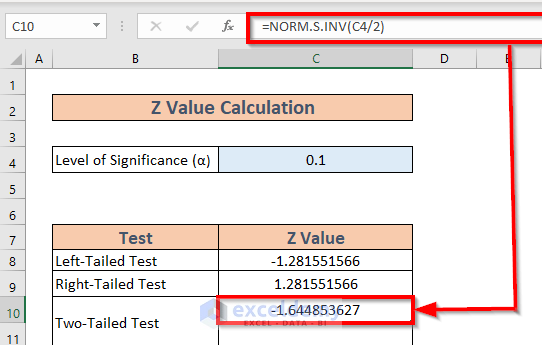
NORM.S.INV function returns the inverse of the standard normal cumulative distribution function. The syntax is NORM.S.INV(probability), where probability is the cumulative probability associated with the critical value you wish to find.
- T-distribution: The T.INV function is used for the t-distribution. The syntax is T.INV(probability, degrees_of_freedom), where probability is the cumulative probability and degrees_of_freedom is the number of degrees of freedom for the t-distribution.
- Chi-Square Distribution: For the chi-square distribution, the CHIINV function is utilized. The syntax is CHIINV(probability, degrees_of_freedom), where probability is the cumulative probability and degrees_of_freedom is the number of degrees of freedom.
- F-Distribution: The FINV function is used to find critical values for the F-distribution. The syntax is FINV(probability, num1, num2), where probability is the cumulative probability, num1 is the numerator degrees of freedom, and num2 is the denominator degrees of freedom.
Steps to Find Critical Values in Excel

Finding critical values in Excel involves using the appropriate function based on the distribution of interest. Here are the steps for each distribution: - For the Standard Normal Distribution (Z-distribution): 1. Determine the desired significance level (α) for your hypothesis test. 2. Since the standard normal distribution is symmetric, for a two-tailed test, you would use
α/2 as the probability argument in the NORM.S.INV function.
3. Enter the formula, for example, =NORM.S.INV(1-0.05/2) for a two-tailed test with α = 0.05.
- For the T-distribution:
1. Decide on the significance level (α) and the degrees of freedom.
2. For a two-tailed test, use α/2 as the probability.
3. Enter the formula, for example, =T.INV(1-0.05/2, 10) for a two-tailed test with α = 0.05 and 10 degrees of freedom.
- For the Chi-Square Distribution:
1. Choose the significance level (α) and the degrees of freedom.
2. Enter the formula, for example, =CHIINV(0.05, 10) for a right-tailed test with α = 0.05 and 10 degrees of freedom.
- For the F-Distribution:
1. Determine the significance level (α), numerator degrees of freedom, and denominator degrees of freedom.
2. Enter the formula, for example, =FINV(0.05, 3, 10) for a right-tailed test with α = 0.05, 3 numerator degrees of freedom, and 10 denominator degrees of freedom.
Example Calculations

Let’s calculate the critical value for a two-tailed t-test with
α = 0.05 and 20 degrees of freedom.
- The formula would be =T.INV(1-0.05/2, 20).
- This calculation returns the critical t-value.
Table of Critical Values

While Excel functions provide a direct way to calculate critical values, it’s sometimes useful to refer to pre-computed tables, especially for distributions and significance levels not directly supported by Excel functions. However, with the flexibility and precision of Excel’s statistical functions, such tables are less necessary than in the past.
| Distribution | Function in Excel | Example Use |
|---|---|---|
| Standard Normal (Z) | NORM.S.INV | =NORM.S.INV(1-0.05/2) |
| T-Distribution | T.INV | =T.INV(1-0.05/2, 10) |
| Chi-Square | CHIINV | =CHIINV(0.05, 10) |
| F-Distribution | FINV | =FINV(0.05, 3, 10) |

📝 Note: Always ensure that your Excel version supports the statistical functions you are using, as functionality can vary between versions.
In summary, finding critical values in Excel is a straightforward process that utilizes specific functions depending on the statistical distribution of interest. By understanding how to apply these functions, you can efficiently perform hypothesis testing and other statistical analyses directly within Excel. This approach not only streamlines your workflow but also enhances the accuracy of your statistical conclusions by minimizing manual calculation errors. With practice, you’ll become proficient in leveraging Excel’s statistical capabilities to meet your analytical needs.


