Master Excel Sheets: Populate and Organize Data Efficiently

Microsoft Excel has become a fundamental tool for data organization, analysis, and presentation across various industries. However, mastering Excel involves more than just knowing how to input data into cells; it requires understanding efficient methods to populate and organize data effectively. This comprehensive guide will explore several techniques and features in Excel that can transform your spreadsheet experience from tedious to triumphant.
Understanding Excel Basics

Before diving into the advanced techniques, let’s revisit the core functionalities of Excel:
- Cell Reference: Cells are identified by their column letter and row number.
- Formulas: These are equations that perform calculations.
- Functions: Predefined formulas like
SUM,AVERAGE,VLOOKUP, etc. - Worksheets and Workbooks: Workbooks contain multiple worksheets where you can organize different datasets.
💡 Note: Understanding these basics forms the foundation for all advanced Excel operations.
Efficient Data Entry

Efficiency in data entry can significantly reduce the time spent on repetitive tasks:
- Data Validation: Use this to control what type of data or the values that users enter into a cell. For example:
< Data Validation >💡 Note: This not only speeds up entry but also reduces errors.
Using Flash Fill

Introduced in Excel 2013, Flash Fill can recognize patterns in your data entry and automatically fill in the remaining cells based on that pattern:
- Enter a few initial examples in a column.
- Press Ctrl + E or go to the “Data” tab and select “Flash Fill.”
Data Forms for Structured Entry

Data Forms can provide a structured way to enter data, especially when dealing with numerous columns:
- Create or select a table.
- Go to “Form” under the “Data” tab.
This opens a form where you can enter data more systematically.
Organizing and Managing Data

Excel offers several features to help manage and organize your data:
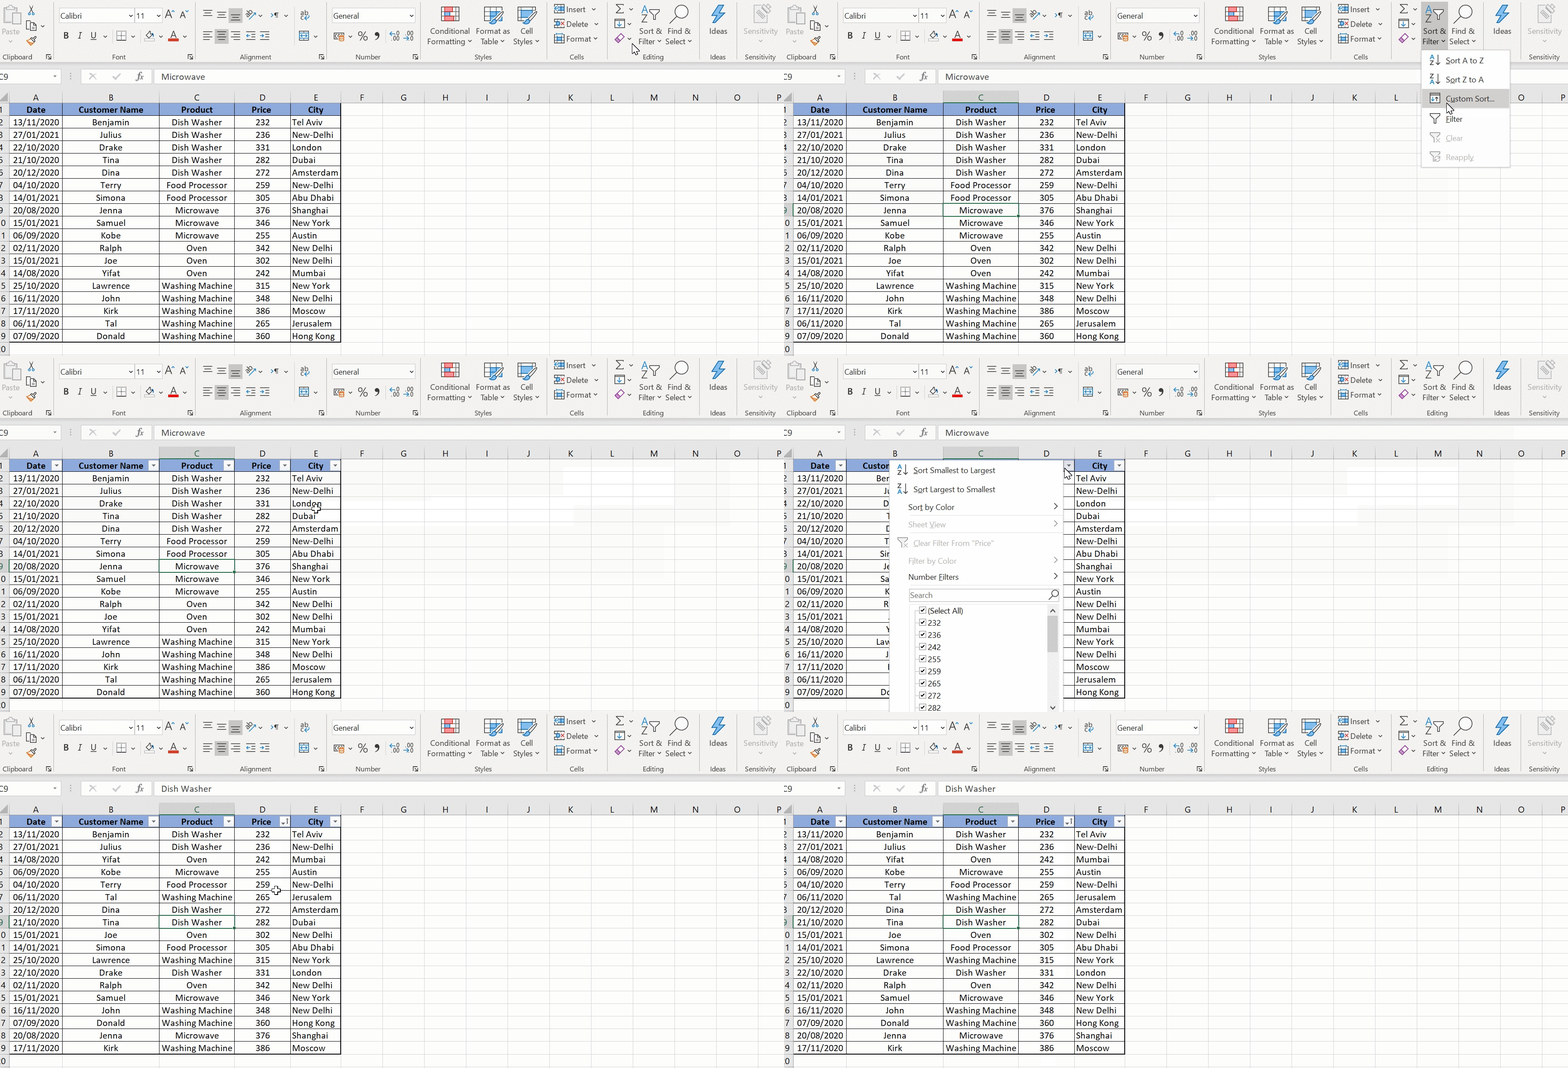
Sorting and Filtering

To sort or filter data:
- Select your range of data.
- Go to the “Data” tab, then choose “Sort” or “Filter.”
- Customize your sorting criteria or filter options.
Conditional Formatting

This feature highlights or formats cells based on certain conditions:
- Select the cells you want to format.
- Navigate to “Home” > “Conditional Formatting” to choose from various rules.
Here’s an example:
< Conditional Formatting Example >Freeze Panes

When working with large datasets, use “Freeze Panes” to keep row and column labels visible:
- Select the row below or the column to the right where you want to freeze.
- Go to “View” > “Freeze Panes.”
Automating Data Entry with Macros

For repetitive tasks, macros can save time:
- Open the “Developer” tab (enable it if necessary in Excel Options).
- Select “Record Macro” to record your actions.
- After performing your repetitive task, stop recording.
💡 Note: Macros can automate data entry, sorting, formatting, and more.
Using Excel Tables

Tables in Excel enhance data management:
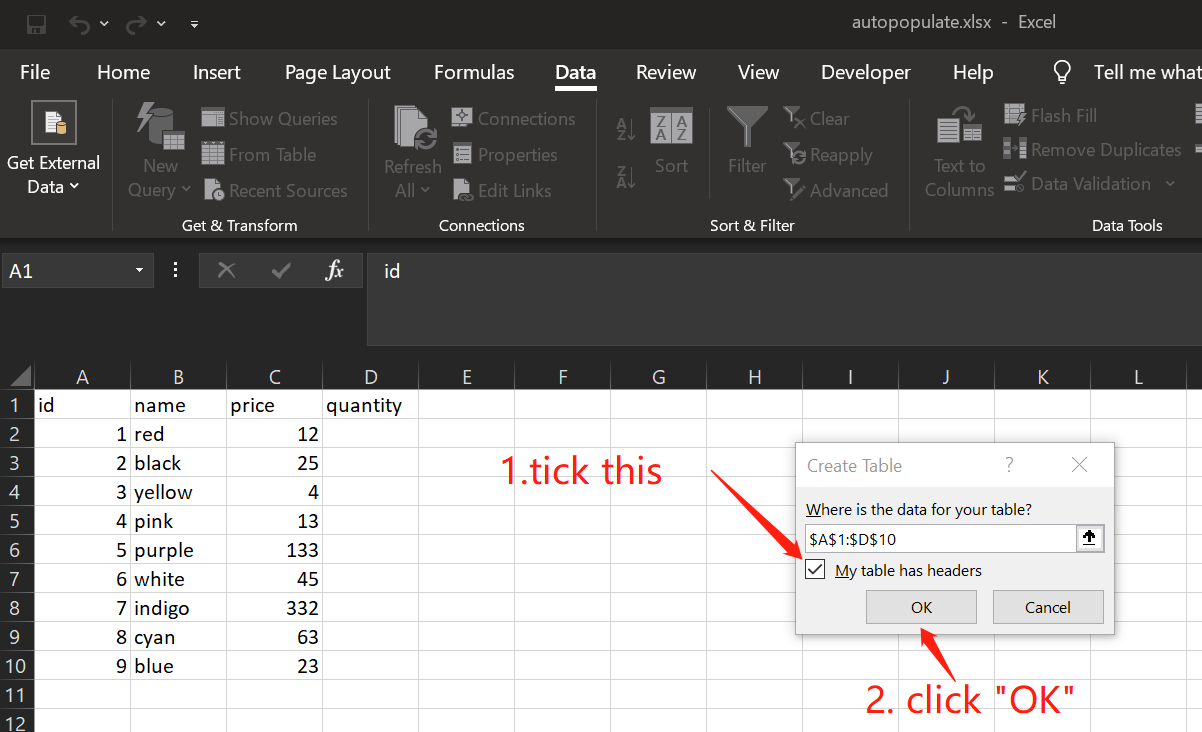
- Convert your range into a table by selecting “Format as Table” under the “Home” tab.
- Benefits include automatic expansion, easy filtering, and consistent formatting.
Advanced Table Features

Here are some advanced features of Excel tables:
| Feature | Description |
|---|---|
| Slicers | Create easy-to-use filters for your data. |
| Calculated Columns | When you add a formula to one column, it automatically propagates to all rows in the table. |
| Total Row | Add a row at the end of your table to show totals or other aggregates. |

Data Consolidation and Pivot Tables

When dealing with data from different sources or sheets:
Consolidate Data

- Select the cell where you want the consolidated data.
- Go to “Data” > “Consolidate” and choose your function like SUM, COUNT, etc.
- Select the ranges from different sheets or sources.
Pivot Tables

- Select your data range.
- Insert a Pivot Table from the “Insert” tab.
- Configure your Pivot Table to analyze, summarize, or slice data in various ways.
Pivot Tables can dynamically reconfigure your data to display insights, summarize trends, or segment information:
Final Thoughts

Mastering Excel sheets for efficient data population and organization involves a blend of understanding Excel’s core functionalities, utilizing features like conditional formatting, and employing advanced tools like macros and pivot tables. By applying these techniques, you can transform the way you interact with data, making your spreadsheet tasks more manageable, less time-consuming, and far more insightful.
What is the best way to handle duplicate data in Excel?

+
To manage duplicates, you can use conditional formatting to highlight them, the “Remove Duplicates” feature under the “Data” tab, or advanced filters to identify unique records.
How can I make my Excel sheets more interactive?

+
Utilize features like Pivot Tables, Slicers, and interactive charts. Macros can also make sheets interactive by running custom scripts.
Can I use Excel for project management?
+Yes, Excel can be adapted for project management using Gantt charts, timelines, and task lists with conditional formatting to track progress and deadlines.
How do I share Excel files securely?
+Use Excel’s “Share” option with Microsoft 365 or OneDrive for cloud-based sharing with access controls, or encrypt files for more secure sharing methods.
Is there a limit to how much data Excel can handle?
+Excel has limitations on the number of rows and columns, and while it can handle large datasets, for extremely large datasets or more powerful analysis, consider using tools like SQL or Power BI.


