Creating Excel Graphs from Another Sheet Easily

When working with large datasets or complex spreadsheets, having the ability to create graphs from another sheet in Microsoft Excel can significantly enhance your productivity and data visualization skills. This post will guide you through the process of linking data from one sheet to another for graph creation, offering step-by-step instructions and highlighting some of the best practices for ensuring your graphs are both informative and visually appealing.
Why Graph Data from Another Sheet?

Graphs are an excellent way to visualize data, making complex information more digestible. Here are several reasons why graphing data from another sheet is beneficial:
- Maintain Data Integrity: By keeping raw data separate from the visualization, you reduce the risk of accidentally modifying data during graph creation.
- Data Organization: Organizing data across multiple sheets can make your workbook more structured, which is particularly useful in large projects.
- Flexibility: Data and graphs can be updated independently, allowing for dynamic reports and dashboards.
- Presentation: A clean graph sheet provides a professional look when presenting or sharing your findings.
How to Create Graphs from Another Sheet

Here’s how you can easily graph data from another sheet:
Step 1: Set Up Your Source Data

Ensure your data is clean, accurate, and formatted in a way that Excel can interpret correctly:
- Keep your data in a table format with headers in the first row.
- Check for any blanks or errors which might affect graph accuracy.
Step 2: Selecting Data from Another Sheet

Follow these steps to select your source data for graphing:
- Go to the sheet where you want to insert the graph.
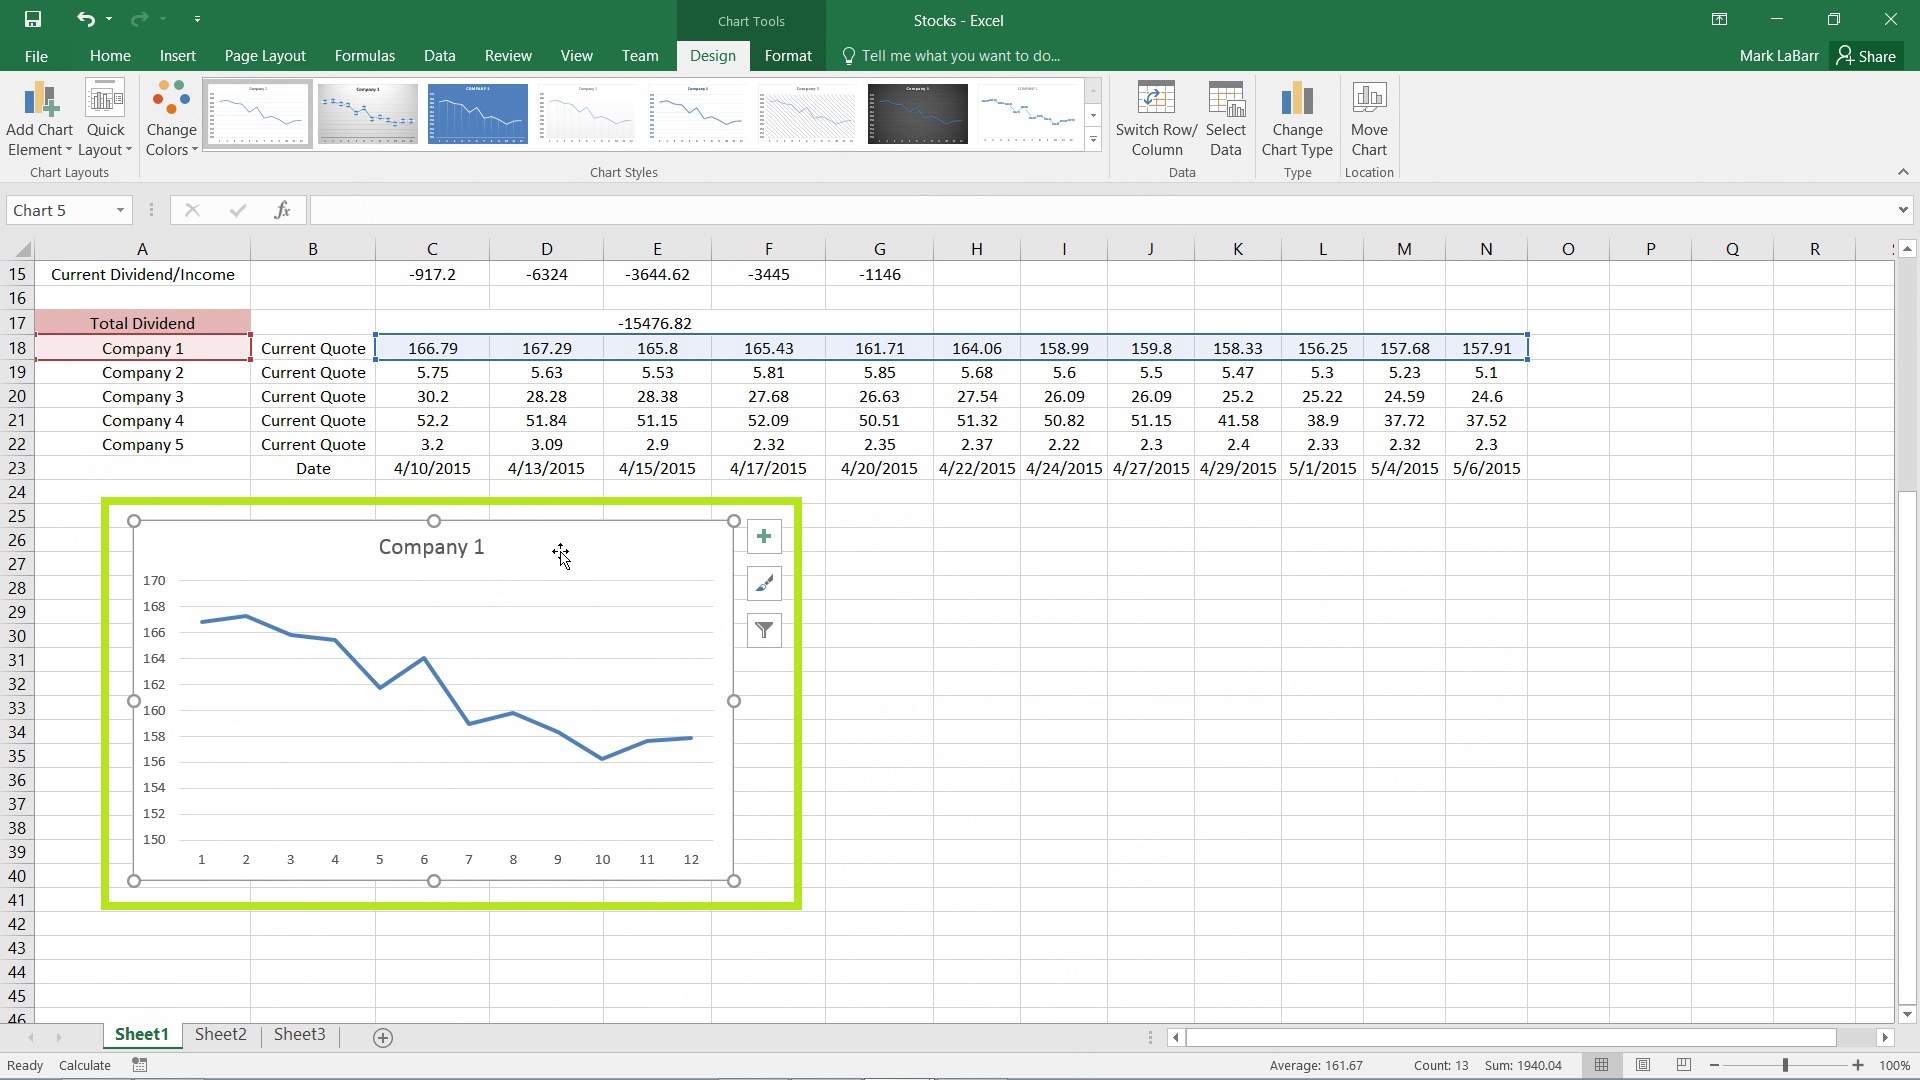
- Click on the chart icon from the ‘Insert’ tab, and choose your desired chart type.
- When the chart template appears, click on the “Select Data” button.
- In the ‘Select Data Source’ dialog, click the ‘Switch Row/Column’ button to adapt your data format if necessary.
- To select data from another sheet, click on the ‘Sheet’ name box in the ‘Series Values’ or ‘Horizontal (Category) Axis Labels’ and navigate to the source sheet.
- Select the range of data you want to include, then confirm with ‘OK’.
Step 3: Creating Your Graph

After selecting your data:
- Your selected data will now appear on your new graph in the sheet where you initiated it.
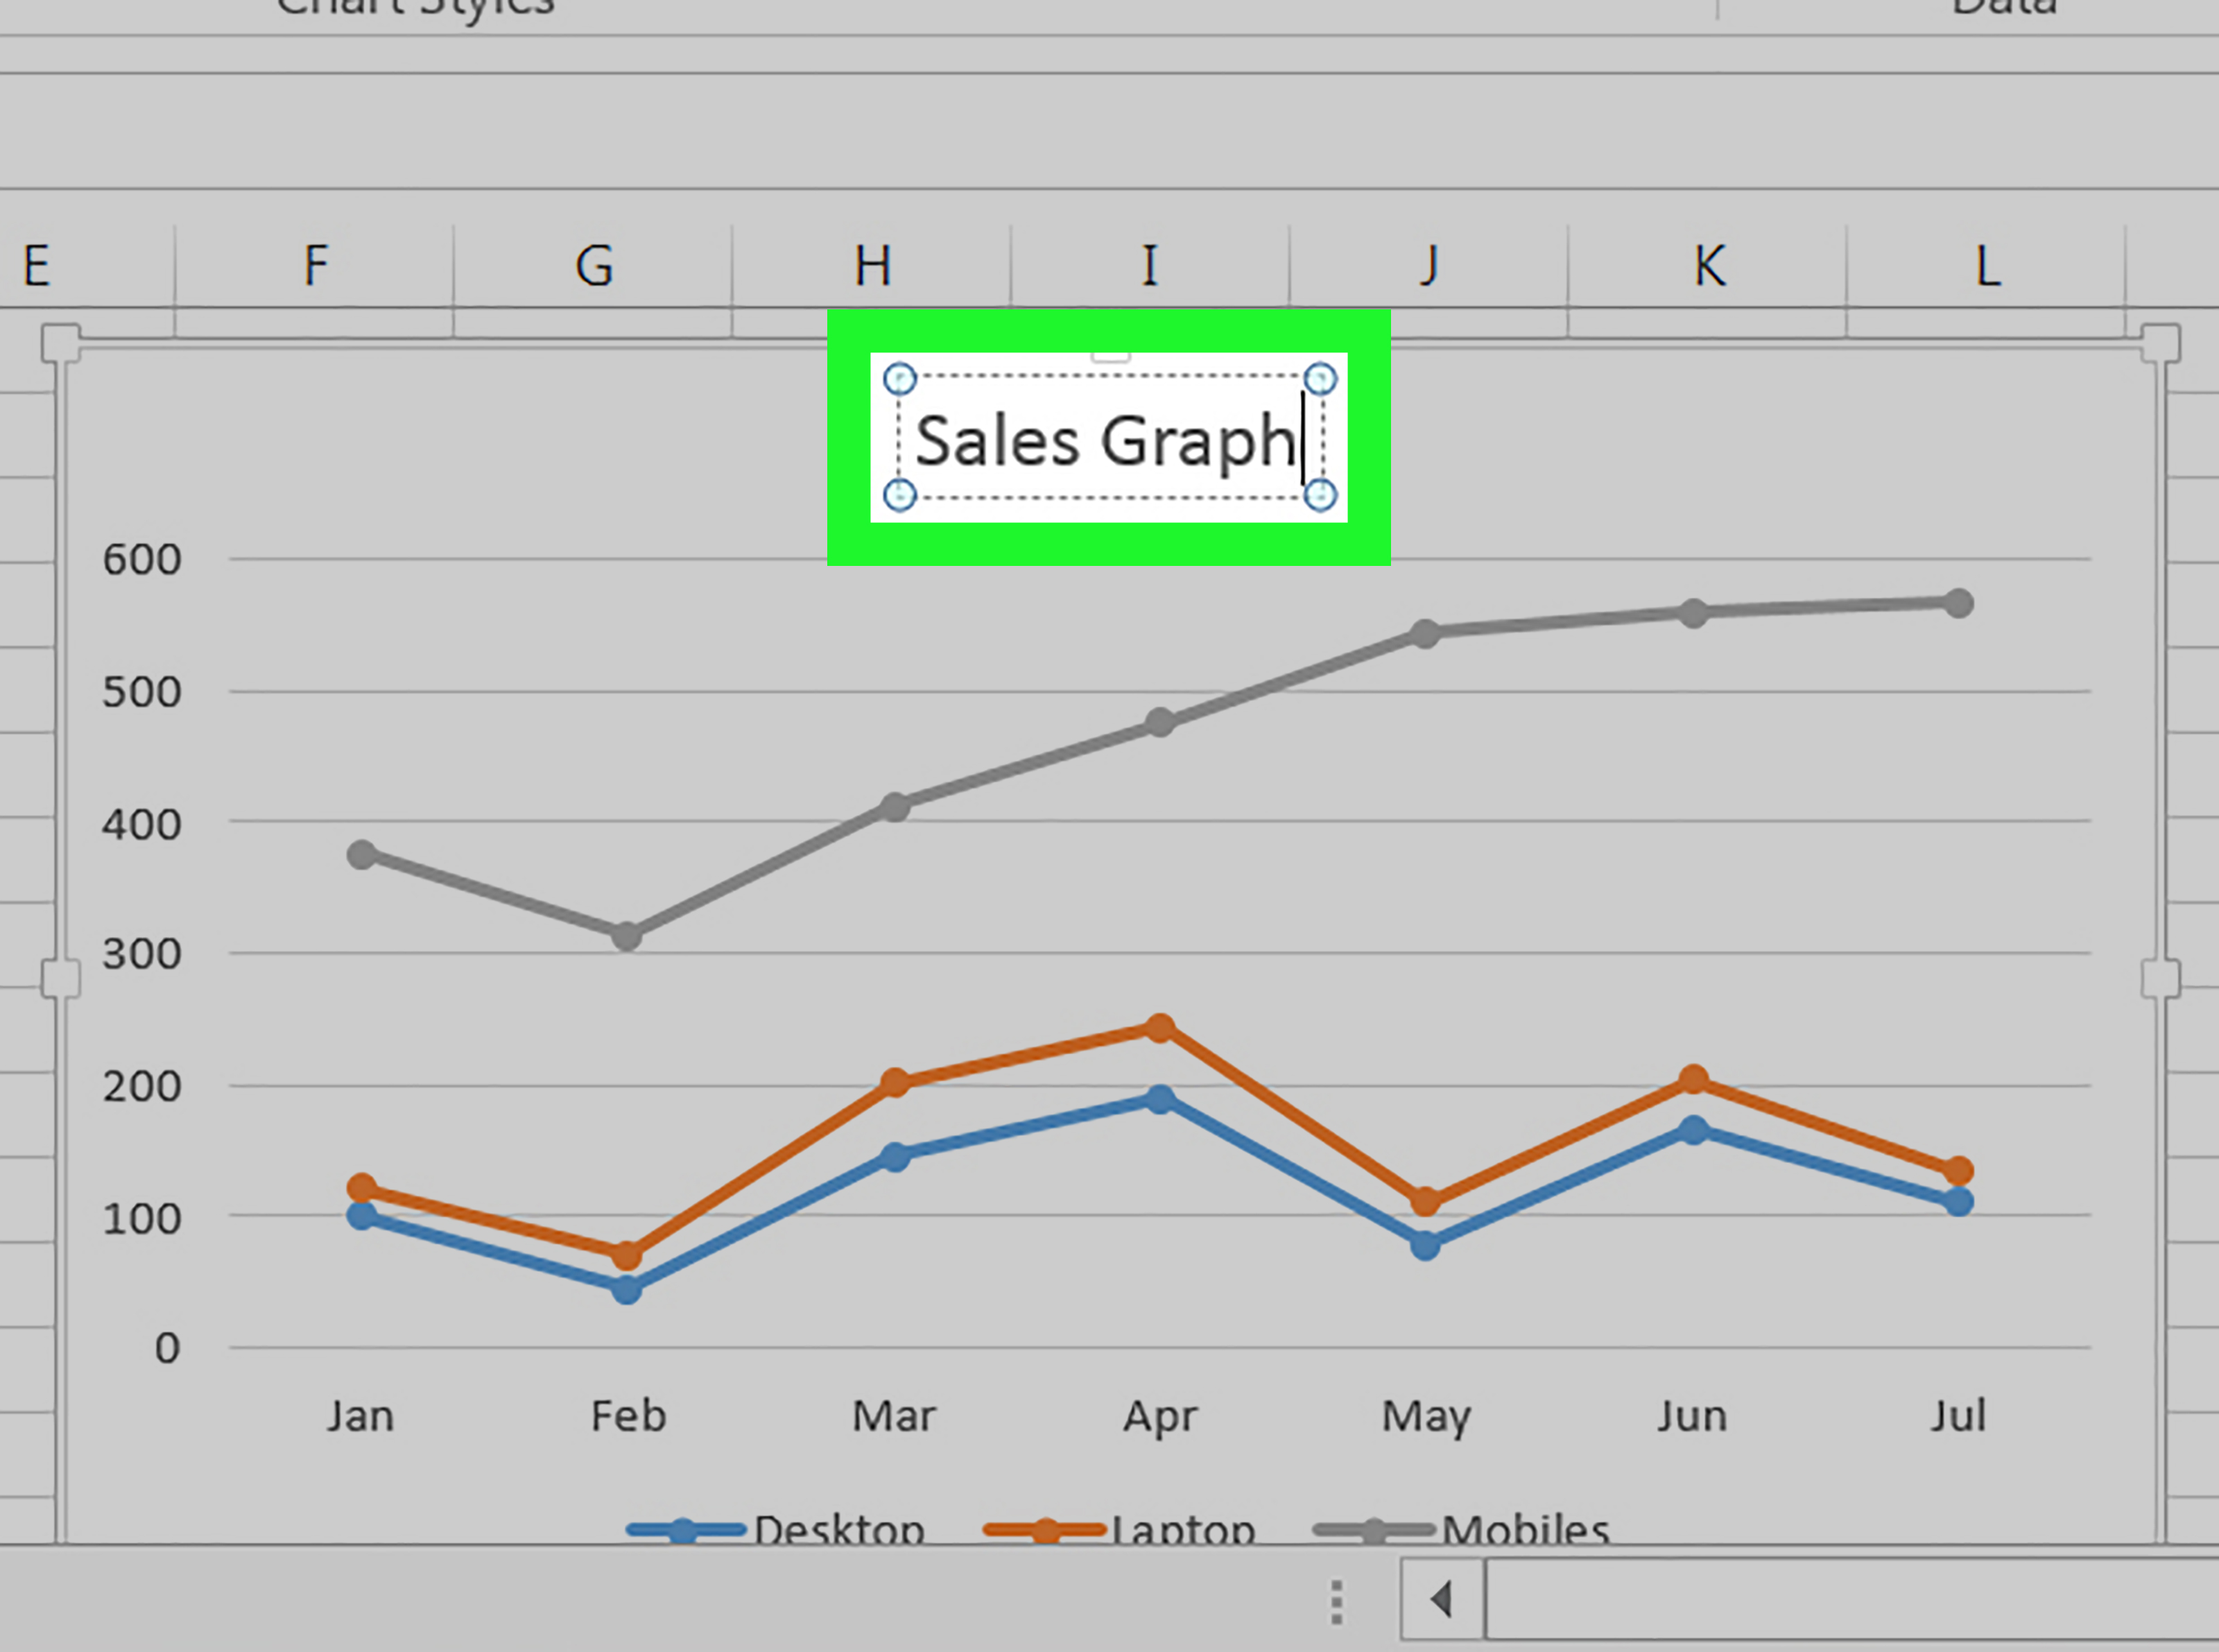
- Customize your graph by adjusting elements like title, axes labels, and colors through the ‘Chart Tools’ menu.
Notes:

⚡ Note: When using ‘Select Data Source’, ensure you’ve selected the correct sheet and range before clicking ‘OK’.
💡 Note: If your source data changes, you can right-click on the graph and choose ‘Select Data’ again to refresh it.
Best Practices for Graph Creation

Here are some tips to make your graphs more effective:
- Use Descriptive Titles: A graph should be self-explanatory. Ensure your title accurately reflects the content of the graph.
- Choose Appropriate Chart Types: Line charts for trends, bar charts for comparisons, and pie charts for proportions, for example.
- Label Clearly: Ensure all axes are labeled, and legends are used if multiple data series are involved.
- Keep it Simple: Avoid clutter by only including necessary data and keeping labels concise.
- Color Consistency: Use colors consistently across your workbook to represent the same categories or data points.
- Data Validation: Double-check your data for any anomalies or errors before graph creation.
Advanced Techniques for Dynamic Graphing

For users looking to push their Excel skills further, consider these advanced techniques:
Using Named Ranges

Named ranges make it easier to reference and update data used in your graphs:
- Go to the sheet containing your data.
- Select the range of data you wish to name.
- Right-click, choose ‘Define Name’, and enter a name for your range.
- When selecting data for your graph, use the named range instead of the cell references.
Dashboard Creation with Multiple Sheets

Create an interactive dashboard:
- Link multiple graphs from different sheets to create an overview of key metrics.
- Use features like ‘PivotCharts’ and ‘Slicers’ for dynamic data filtering and analysis.
Conditional Formatting for Data Visualization

Use conditional formatting to highlight trends or important values in your source data:
- This can help in identifying outliers or changes in data before they are graphed.
🔍 Note: Be cautious with dynamic formulas or ranges as they might cause errors in your graphs if not maintained properly.
To enhance your Excel graphing skills, remember that practice and experimentation are key. As you create more graphs from different sheets, you'll develop a sense for what works best in terms of readability, visual appeal, and efficiency.
Working with data across multiple sheets for graphing not only streamlines your workflow but also allows for a more organized presentation of information. This process, once mastered, can greatly improve your ability to communicate complex data through effective visualizations. Whether you're a data analyst, a business professional, or just someone who loves to crunch numbers, knowing how to link data from different sheets in Excel for graphing will undoubtedly add value to your analytical toolkit.
Can I create graphs with data from different workbooks?

+
Yes, you can. Use the ‘External Data Range’ feature to link data from different workbooks into a single workbook for graphing purposes.
How can I ensure my graph updates when the source data changes?

+
Set up your graph to use a dynamic range or a named range that adjusts with your data. When the source data changes, use the ‘Refresh’ option or reopen the workbook to update your graph.
What if I want to change the range of data my graph uses?

+
Right-click on the graph, select ‘Select Data’, and then modify the range for the data series or axis labels as needed.
Is it possible to automate graph creation from another sheet?
+Yes, you can use VBA (Visual Basic for Applications) to automate graph creation from multiple sheets, but this requires some programming knowledge.


