Creating Bar Graphs in Excel: Simple Steps to Visualize Data

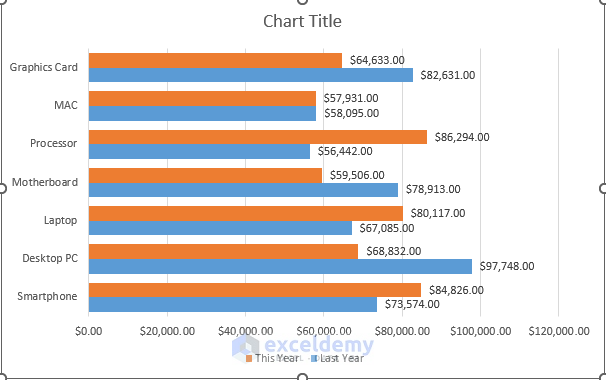
Bar graphs are a fundamental tool for visually representing data in Excel. Whether you're analyzing sales figures, survey results, or any categorical data, Excel's bar graph functionality can simplify the process of visualizing and understanding your data. This blog post will guide you through the straightforward steps to create bar graphs, customize them to fit your presentation, and even integrate dynamic elements for a professional touch. Let's dive into the world of data visualization with Excel.
Step 1: Gather and Organize Your Data

Before you can plot any graph, you need to ensure your data is organized in a manner conducive to charting:
- Ensure your data is sorted in a table or list.
- Columns should represent categories or series, and rows should contain values or responses.
- Select your range carefully, as any excluded data will not appear in your chart.

Step 2: Insert a Bar Graph

Once your data is ready, follow these steps to insert a bar graph:
- Highlight the cells containing your data, including headers.
- Go to the Insert tab on the Ribbon.
- Click on the Bar or Column chart icon (depending on your Excel version).
- Choose your preferred type of bar graph from the options presented (e.g., Clustered Bar, Stacked Bar, etc.).

Step 3: Customize Your Bar Graph

Customization is key to making your bar graph more informative and visually appealing:
- Select your graph to bring up the Chart Tools tab.
- Use the Design tab to switch to different chart styles or change the chart type.
- Adjust colors, font sizes, and gridlines in the Format tab.
- Add Chart Title, Legend, Axis Titles, and Data Labels for clarity.
⚠️ Note: Overcustomization can make your chart confusing. Balance aesthetics with clarity.
| Customization Option | Description |
|---|---|
| Change Colors | Modify bar colors to differentiate categories or series. |
| Axis Labels | Ensure your audience understands the scale and categories by adding labels. |
| Chart Styles | Switch between pre-set styles for instant visual improvements. |

Step 4: Dynamic Data Visualization

To make your graphs more dynamic:
- Use Sparklines or conditional formatting to highlight trends within the chart.
- Consider adding Interactive elements like sliders or dropdowns for data filters (requires VBA).

Summing Up

Creating a bar graph in Excel involves simple steps that can visually convey your data’s story in an intuitive manner. From organizing your data to customizing your chart, you can now present your analysis with clarity and visual appeal. Remember to keep your charts simple, yet informative, ensuring your audience can easily interpret the trends and patterns in your data. Utilizing Excel’s built-in features for dynamic data presentation can further enhance the professionalism and interactivity of your reports, making complex data more accessible.
How do I choose between a column and a bar graph?

+
Column charts are typically used for comparing values across categories, while bar charts are better for showing values over time or when category labels are long. Use column charts if you want vertical comparison and bar charts for horizontal comparison.
Can I create a 3D bar graph in Excel?

+
Yes, Excel supports 3D bar graphs, but they are generally advised against due to potential readability issues and the distortion of perspective that can mislead viewers. Flat, 2D charts are usually clearer and more accurate.
What if my data changes frequently?

+
For frequently updated data, use dynamic charts with named ranges or tables. Excel will automatically update the chart when the data in these ranges changes. Also, consider using VBA for more advanced interactivity like data filtering.


