Calculate Subtotal in Excel: Quick Guide

Understanding how to calculate subtotal in Excel can streamline your data analysis, making it more efficient and organized. Whether you're managing financial records, inventory, or sales data, Excel's subtotal feature can significantly enhance your productivity by helping you group and summarize data in multiple ways. In this guide, we will delve into different methods for calculating subtotals in Excel, ensuring you can select the best approach for your needs.
Why Use Subtotals?

Subtotals are a critical feature in Excel when dealing with large datasets where grouping and summarizing information is necessary. Here’s why they are important:
- Improved Data Organization: Subtotals group similar data together, making it easier to understand and navigate.
- Quick Summary: They provide quick insights into the data, allowing for easy interpretation.
- Efficiency: When you have to present data, subtotals save time by automatically calculating sums, averages, or counts for different groups.
- Automated Calculations: With subtotals, any changes in the dataset are automatically reflected in the subtotals, ensuring real-time accuracy.
Steps to Add Subtotals in Excel

Let’s walk through the process of adding subtotals in Excel:
1. Prepare Your Data

- Ensure your data is organized in rows with headers in the first row.
- Sort your data based on the column you want to group by. For example, if you’re grouping by category, sort your data by the ‘Category’ column.
2. Select the Data Range

Click and drag to select the entire dataset or hold Ctrl (or Cmd on Mac) and click to select discontinuous data ranges if needed.
3. Use the Subtotal Feature

- Go to the Data tab on the Ribbon.
- Click on Subtotal in the ‘Outline’ group.
- The Subtotal dialog box appears where you can:
- Choose the column to group by from the ‘At each change in’ dropdown.
- Select the function you want to use (SUM, COUNT, AVERAGE, etc.) from the ‘Use function’ dropdown.
- Check the column(s) you want to calculate the subtotals for under ‘Add subtotal to’.
- Decide if you want summary rows to be displayed at the top or bottom of each group.
- Choose whether to replace current subtotals or add new ones.
- Optionally, include page breaks between groups for printing purposes.
4. Customizing Subtotals

Excel provides some customization options for your subtotals:
- Changing Subtotal Functions: You can change the function used in subtotaling by clicking back into the Subtotal dialog box.
- Removing Subtotals: Go to the Data tab and click on Subtotal, then select ‘Remove All’ to clear all subtotals.
🗒️ Note: If you need to remove subtotals from one group without affecting others, you can manually delete the subtotal rows instead of using 'Remove All'.
5. Outlining and Collapsing Subtotals

After adding subtotals, Excel automatically creates an outline. This outline provides buttons to collapse or expand groups:
- Click the 1 or 2 buttons to show or hide different levels of detail.
- You can also use the minus (-) and plus (+) symbols next to the row headers to collapse or expand individual groups.
Advanced Subtotal Techniques

1. Nested Subtotals

You can create nested subtotals by:
- Sorting your data based on two or more columns in a hierarchical order.
- Applying subtotals for the first level of grouping.
- Then, applying subtotals for the second level within each group.
2. Subtotaling Multiple Functions at Once

Excel allows you to:
- Select multiple columns for different functions in the Subtotal dialog box.
- This way, you can have subtotals for SUM, COUNT, and AVERAGE all in one go.
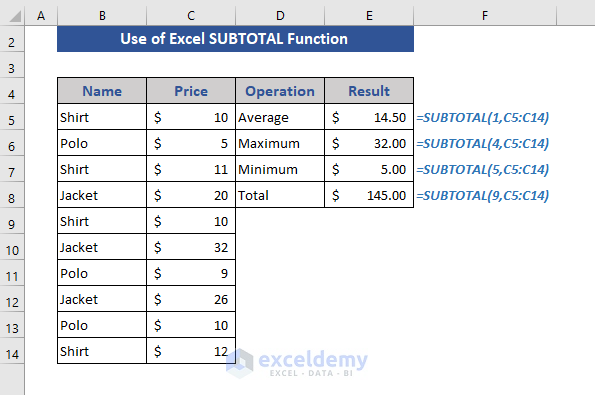
3. Using Subtotal Function in Formulas

With the SUBTOTAL function, you can:
- Calculate subtotals excluding hidden rows in complex datasets.
- Apply it to a range of cells, specifying the function type (e.g., 9 for SUM, 102 for COUNT).
4. Subtotal with Filters

Subtotals can be used with Excel’s filter functionality:
- Apply a filter to your data, and Excel will only subtotal the visible filtered data.
- This is useful when you need subtotals for specific subsets of your data.
In summary, Excel's subtotal feature is a powerful tool for data organization and analysis. It allows you to quickly summarize grouped data, offering a dynamic way to interact with large datasets. By following the steps outlined, you can efficiently add, customize, and manipulate subtotals to suit your data needs. With the capability to nest subtotals, use multiple functions, apply filters, and more, Excel provides ample flexibility for managing and presenting your data effectively. Remember, the key to mastering subtotaling in Excel lies in organizing your data well and using the Subtotal feature creatively to meet your reporting requirements.
Can I have subtotals for multiple columns at once?

+
Yes, you can select multiple columns in the Subtotal dialog box to calculate subtotals for different columns using different functions at once.
How do I remove subtotals from a single group?
+To remove subtotals from a single group, manually delete the subtotal rows for that group, instead of using ‘Remove All’ which will clear all subtotals.
What functions can I use with the Subtotal feature?
+Excel’s Subtotal feature supports several functions like SUM, COUNT, AVERAGE, MAX, MIN, PRODUCT, COUNTA, VAR, VARP, STD, STDP, among others.


