5 Simple Steps to Excel Regression Analysis

Excel is an incredibly versatile tool used by millions of professionals to organize, analyze, and interpret data. Among its numerous functions, regression analysis stands out as a powerful technique for understanding relationships between variables. Whether you're an economist, marketer, data analyst, or student, learning how to perform regression analysis in Excel can significantly enhance your data interpretation skills. This blog post will guide you through five simple steps to conduct regression analysis in Excel, providing you with practical knowledge to turn raw data into insightful information.
Step 1: Preparing Your Data

Before you start with regression analysis, you need to ensure your data is well-organized and clean. Here are the initial steps you should take:
- Input Data Correctly: Your data should be entered into an Excel worksheet with independent variables in columns and dependent variables in a separate column. For instance, if you’re analyzing the impact of advertising spend and product quality on sales, your columns could be labeled as ‘Advertising_Spend’, ‘Product_Quality’, and ‘Sales’.
- Check for Missing Values: Missing or incomplete data can skew your analysis. Use Excel’s filter function or conditional formatting to spot and deal with these issues. You might choose to delete rows with missing values, fill them with estimates, or use advanced methods like imputation.
- Normalize the Data: If your variables are on different scales, consider normalizing them to avoid bias in the regression analysis. You can use the STANDARDIZE function or transform data into z-scores.
- Outliers: Identify outliers using graphical tools like box plots or scatter plots. Decide whether to remove them or treat them appropriately based on your analysis context.
⚠️ Note: Improper data preparation can lead to misleading results in regression analysis. Always double-check your data for consistency and correctness before proceeding.
Step 2: Accessing Excel’s Data Analysis Toolpak

Excel has a built-in Data Analysis Toolpak that includes the regression analysis function. Here’s how to access it:
- Open Excel and click on the ‘File’ tab.
- Go to ‘Options’ and then to ‘Add-Ins’.
- At the bottom of the window, select ‘Analysis ToolPak’ from the list, then click ‘Go’.
- Check the box next to ‘Analysis ToolPak’ and click ‘OK’. Now, you’ll see a ‘Data Analysis’ option under the Data tab.
This toolpak simplifies the process of performing complex statistical operations, including regression analysis, without needing to write complex formulas.
Step 3: Running Regression Analysis

With your data prepared and the Analysis Toolpak installed, you can now run the regression analysis:
- Go to the ‘Data’ tab, and click on ‘Data Analysis’.
- From the list, choose ‘Regression’ and click ‘OK’.
- In the Regression dialogue box:
- Input the range for your Y (dependent) variable in the ‘Input Y Range’.
- Input the range for your X (independent) variables in the ‘Input X Range’.
- Choose ‘Labels’ if your data includes headers.
- Select an ‘Output Option’ like ‘New Worksheet Ply’ for easy access to results.
- Click ‘OK’ to run the analysis.
Step 4: Interpreting Regression Results

Interpreting regression results can be challenging, but here’s what to focus on:
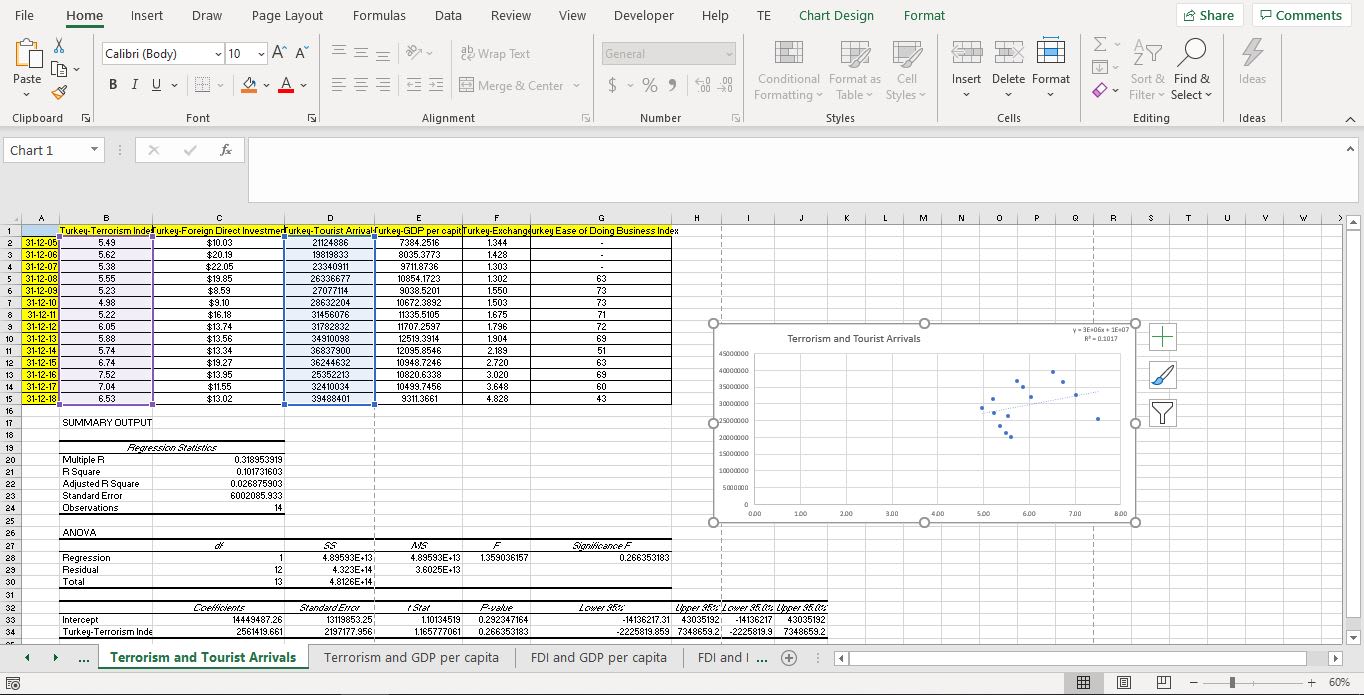
| Component | What to Look For |
|---|---|
| Coefficients | These tell you the expected change in the dependent variable for a one-unit change in an independent variable, assuming all other variables are held constant. Positive coefficients indicate a positive relationship, while negative ones show a negative relationship. |
| R Squared | This value represents the proportion of variance in the dependent variable explained by the independent variables. A value closer to 1 indicates a better fit of the model. |
| P-Values | Used to determine the statistical significance of your predictors. A low p-value (typically below 0.05) suggests that the relationship observed is unlikely to have occurred by chance. |
| Standard Error | This measures the average distance that the observed values deviate from the regression line. Lower values indicate a better fit. |
| Residuals | Checking residuals can help identify issues with your model, like heteroscedasticity or non-linearity. |

Make sure to understand how each metric affects the interpretation of your model. For instance:
- If the p-value is greater than 0.05, it suggests the variable might not significantly contribute to explaining the variation in your dependent variable.
- If R-squared is low, your model might not be capturing the relationships effectively, suggesting a need for reevaluation or the inclusion of more variables.
Step 5: Applying and Enhancing Your Model

After analyzing the results, consider these next steps to improve and apply your model:
- Model Diagnostics: Look at the residuals plot to check for any pattern that might indicate model issues like heteroscedasticity or nonlinearity.
- Variable Interaction: Sometimes, the effect of one variable on another depends on another variable. Use interaction terms to explore these dynamics.
- Further Analysis: Consider:
- Stepwise Regression to add or remove variables automatically.
- Logarithmic or polynomial regression if you suspect non-linear relationships.
- Time series analysis if dealing with time-dependent data.
- Practical Application: Apply the insights gained from your regression analysis to real-world scenarios. For example, use regression coefficients to forecast future trends or understand how different factors impact sales.
💡 Note: Regression analysis is not just about running numbers; it's about understanding the story your data tells. Use your results wisely to make informed decisions.
By following these steps, you've not only learned how to perform regression analysis in Excel but also how to interpret and apply those findings to gain meaningful insights. Regression analysis can help you make better business decisions, understand market trends, and optimize strategies. Remember, like any tool, the more you practice using regression analysis, the more proficient you'll become in extracting valuable information from your data.
Can regression analysis predict future values?

+
Yes, regression analysis can predict future values with some degree of accuracy if the underlying relationships between variables remain constant. However, predictions are always subject to uncertainty due to model limitations and external factors not included in the model.
What does multicollinearity mean in regression analysis?

+
Multicollinearity occurs when independent variables in a regression model are highly correlated. This can make it difficult to determine the individual effect of each predictor on the dependent variable, potentially leading to unstable coefficient estimates.
How can I improve the accuracy of my regression model?

+
Improving model accuracy involves several strategies:
- Gathering more or better-quality data.
- Selecting more relevant predictors or adding interaction terms.
- Dealing with multicollinearity.
- Using different regression methods like polynomial or time series analysis when appropriate.


