Boost Your Numbers: Calculating Percentage Increase in Excel

Understanding Percentage Increase

Percentage increase is a useful calculation when comparing growth between two numbers or datasets. Whether you’re tracking the progress of your investment portfolio, analyzing sales data, or simply calculating how much a quantity has grown, understanding how to compute percentage increase is vital.

Before we dive into the practical steps, let’s lay out the formula:
Percentage Increase = ((New Value - Original Value) / Original Value) * 100%
It’s intuitive, isn’t it? We’ll illustrate how this translates into Excel.
Step-by-Step Guide to Calculate Percentage Increase in Excel

1. Prepare Your Data

- First, organize your data. Let’s say you’re comparing sales numbers between two periods. Label one column as Original Sales and another as New Sales.
- Enter your initial and final values in these respective columns.
2. Enter the Formula

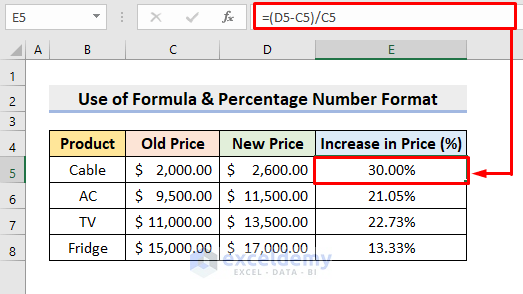
- Select a cell where you want the percentage increase to appear, let’s call it C2.
- Start with an equal sign to indicate you’re entering a formula, then type in: =((B2-A2)/A2)*100. Here, A2 contains the original sales value, and B2 has the new sales value.
- Press Enter.
3. Format the Result

- The number will appear as a decimal. To see it as a percentage, select the cell and press Ctrl + 1 (or right-click and choose Format Cells).
- From the Number tab, select Percentage and set the decimal places as needed.
⚠️ Note: If you're using the percentage format, Excel will automatically convert the formula's result to a percentage.
4. Extend the Formula

- If your sales data extends over many rows, use the fill handle (a small square in the bottom-right corner of the cell) to drag the formula down, automatically calculating for all rows.
5. Visualize the Data

- Consider adding a chart to visually represent your percentage increase. Excel offers various chart types, but for percentage changes, a Column or Line chart would be effective.
Alternative Methods for Calculating Percentage Increase

While the above steps provide a straightforward way, there are scenarios where you might use different approaches:
Using Excel Functions

- You can also use ABS, MAX, and MIN functions to compute percentage differences in more complex scenarios, especially when dealing with datasets containing both positive and negative changes.
Percentage Increase over Multiple Periods

- If you need to calculate compound growth rates over several periods, delve into the XIRR function for investments, or manually calculate cumulative percentage increase.
💡 Note: For investment portfolios, knowing the compound annual growth rate (CAGR) can be more informative than single-period percentage increase.
Practical Applications

Let’s look at how you might apply percentage increase calculations in real-life scenarios:
Business Analytics

- Track sales growth, stock performance, or employee performance metrics like productivity or sales quotas.
Financial Analysis

- Analyze portfolio returns, investment growth, or even inflation effects on savings.
Health and Fitness

- Measure weight loss or muscle gain as a percentage of starting values to motivate and track progress.
Understanding how to compute percentage increase in Excel isn't just about learning a formula; it's about interpreting growth, which informs decision-making across various fields.
Can I calculate percentage decrease with the same formula?
+Yes, the same formula works for both increases and decreases. You’ll end up with a negative value for decreases, which you can format accordingly.
What if one or both of the numbers are negative?
+The formula still applies. Negative numbers just reflect negative growth, and percentage changes can still be positive (if the negative value becomes less negative) or negative (if it becomes more negative).
How does Excel handle percentage formatting?
+Excel automatically converts numbers to percentages if you choose the percentage format. It essentially multiplies the value by 100 and adds a percent sign.
Applying these insights will not only enhance your understanding of data but also sharpen your decision-making processes. It’s amazing how a simple calculation can provide profound insights into various aspects of personal and professional life. Remember, growth and change are constants; mastering the tools to quantify these changes equips you to better navigate this dynamic environment.


