Calculate Coefficient of Variation Easily in Excel
Introduction

Are you an analyst or a statistician looking to measure the relative variability of a dataset? If so, understanding how to calculate the Coefficient of Variation (CV) in Excel can be extremely beneficial. This measure not only provides insights into the variability of your data but also helps in comparing datasets that have different units or scales. Let’s dive into how you can leverage Excel to calculate CV effortlessly.
What is the Coefficient of Variation?
The Coefficient of Variation, often abbreviated as CV, is a statistical measure that represents the ratio of the standard deviation to the mean. It is expressed as a percentage, making it a unitless measure, which is particularly useful when comparing the degree of variation from one dataset to another, especially when these datasets have different means and units of measurement.
Formula for CV
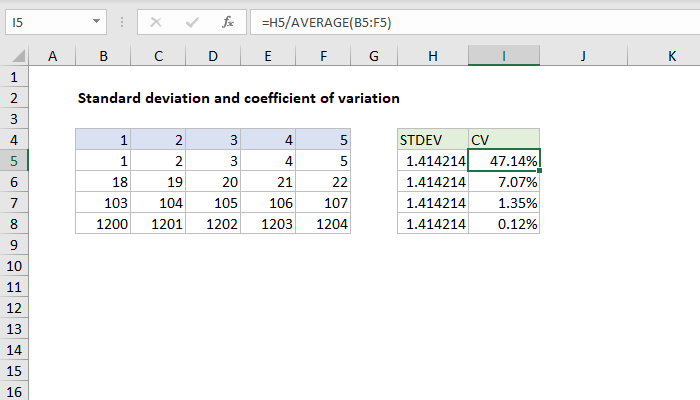
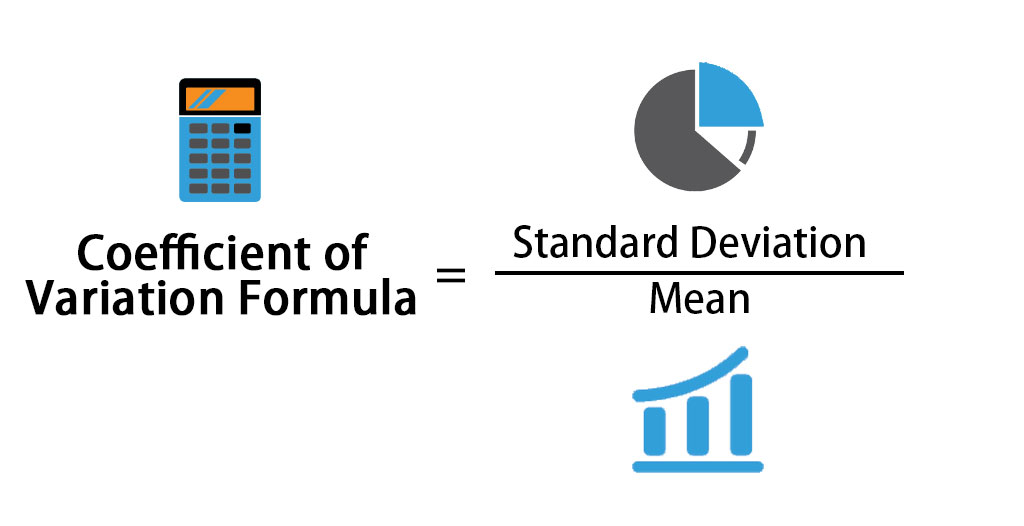
The formula for calculating the Coefficient of Variation is:
[ \text{CV} = \frac{\text{Standard Deviation}}{\text{Mean}} \times 100 ]Prerequisites

Before we start with the steps to calculate CV in Excel, ensure that:
- You have a dataset in a column in Excel.
- You are familiar with basic Excel functions like STDEV.P(), AVERAGE(), and basic arithmetic operations.
Step-by-Step Guide to Calculate CV in Excel

1. Gather Your Data
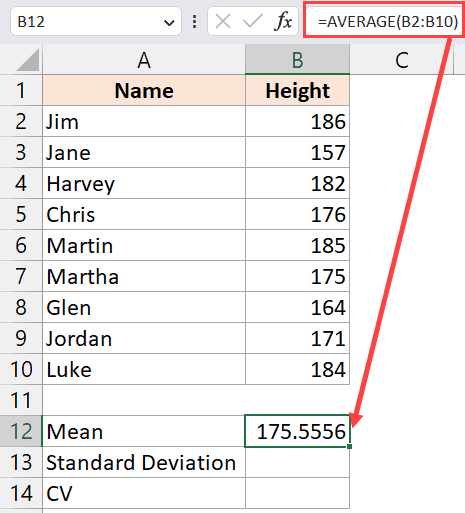
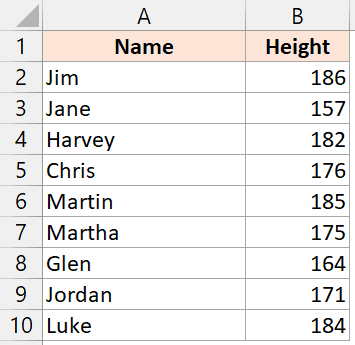
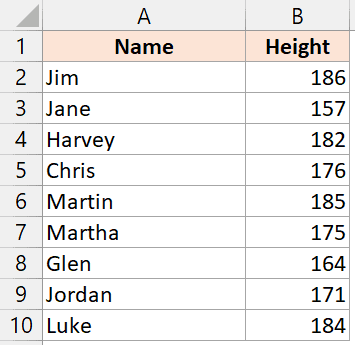
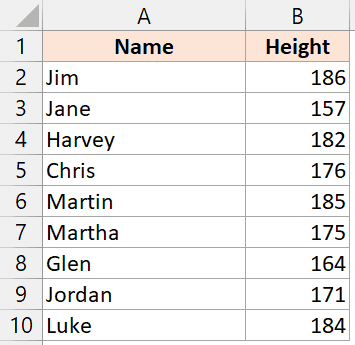
Let’s assume your data is listed in cells A1 through A10:
2. Calculate the Mean

Use the AVERAGE function to find the mean of your dataset. Enter the following formula in cell B1:
=AVERAGE(A1:A10) 3. Calculate the Standard Deviation
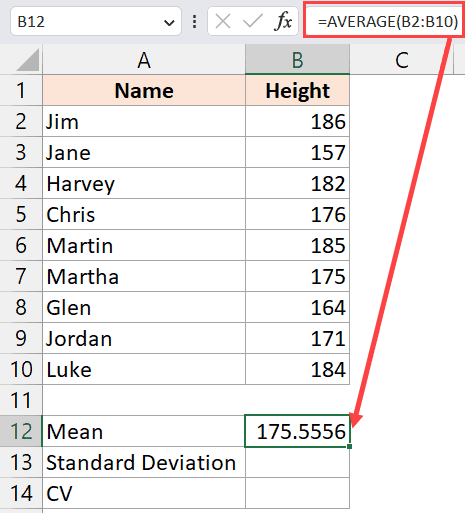
The standard deviation can be calculated using STDEV.P() for the population standard deviation or STDEV.S() for the sample standard deviation. If you’re dealing with a sample, use this formula in cell B2:
=STDEV.S(A1:A10) 4. Calculate the CV
Now, divide the standard deviation by the mean and multiply by 100 to get the CV in percentage. Enter the following formula in cell B3:
=(B2/B1)*100 5. Formatting the Result
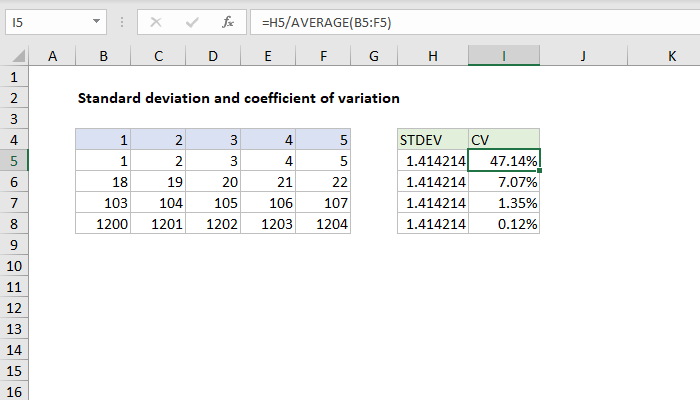
Format cell B3 to display the percentage. Right-click on cell B3, choose ‘Format Cells’, select ‘Percentage’, and choose the number of decimal places you need.
⚠️ Note: If your data represents a population, use STDEV.P() instead of STDEV.S().
6. Optional: Create a Table
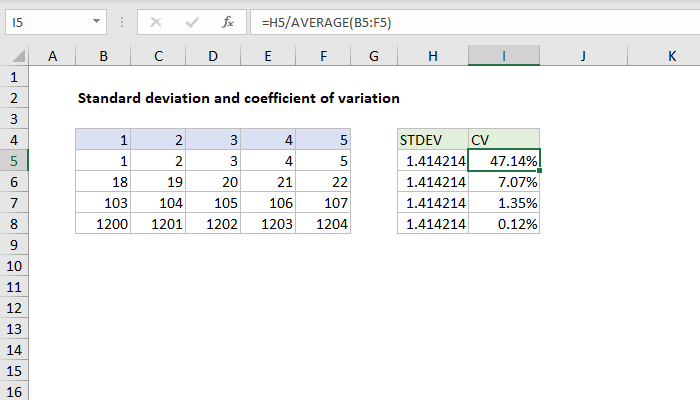
Here’s how you can create a table in Excel to display your results:
| Data | Value |
|---|---|
| Mean | =B1 |
| Standard Deviation | =B2 |
| Coefficient of Variation | =B3 |

Interpretation of CV

The Coefficient of Variation helps in understanding the variability in relation to the mean:
- A lower CV indicates less variability and greater consistency among the values in the dataset.
- A higher CV suggests higher variability or less consistency.
- In comparative studies, a lower CV is often preferable as it indicates a more homogeneous dataset.
Advanced Tips
Using Conditional Formatting

You can use conditional formatting to highlight cells where the CV falls within a certain range, aiding in quick visual analysis:
- Select cell B3.
- Go to ‘Home’ > ‘Conditional Formatting’ > ‘New Rule’.
- Choose ‘Format only cells that contain’.
- Set the condition, for example, to highlight values below 30% in green.
Using Named Ranges

To make your formulas more readable, use named ranges. For example, name the range A1:A10 as ‘Data’. Your formulas would then look like this:
=AVERAGE(Data)
=STDEV.S(Data)
=(STDEV.S(Data)/AVERAGE(Data))*100
📝 Note: Named ranges are extremely useful for readability and also reduce errors when formulas are updated or changed.
Common Mistakes to Avoid

- Confusing population vs. sample: Remember to choose the appropriate standard deviation function based on your dataset.
- Incorrect range selection: Ensure that your data range does not include any non-numeric entries or empty cells that could skew your results.
- Formatting errors: Don’t forget to format the CV result as a percentage for better readability.
In summary, understanding and calculating the Coefficient of Variation in Excel provides a powerful tool for data analysis. By following these steps, you can easily quantify variability in datasets, compare different distributions, and make more informed decisions. Remember to keep your dataset clean, choose the correct standard deviation function, and format your results appropriately for an effective analysis.
What does a low CV indicate?

+
A low Coefficient of Variation indicates less variability and greater consistency among the values in your dataset. This might suggest that your data points are closely grouped around the mean.
Can CV be used for any type of data?
+
Yes, CV is unitless, so it can be used to compare the degree of variation from one dataset to another, even if they have different scales or units of measurement.
Is a higher or lower CV better?
+This depends on context. In financial analysis or quality control, a lower CV is typically preferred as it indicates less variability and more reliability. However, in certain research settings, a higher CV might indicate a wider range of possibilities, which can be useful for exploratory studies.

