5 Simple Steps to Add Percentages in Excel

Excel is not just a tool for numbers; it's a powerful platform for data analysis and presentation. Understanding how to handle percentages within this tool can significantly enhance your ability to analyze data effectively. In this guide, we'll walk through five straightforward steps to add percentages in Excel, ensuring you can make the most out of your financial spreadsheets, statistical data, or any scenario involving percentage calculations.
1. Understanding the Basics of Percentages in Excel

Before diving into the steps, it’s important to understand how Excel perceives percentages. A percentage in Excel is nothing more than a decimal or whole number divided by 100:
- 5% in Excel would be represented as 0.05.
- 100% is simply 1.
Working with the Percentage Format

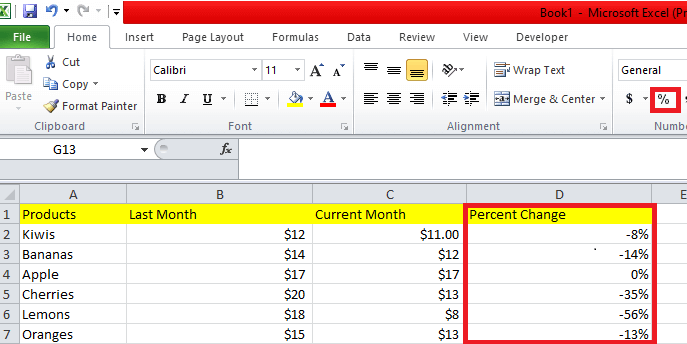
To display a number as a percentage, you can simply change its format:
- Select the cells you want to format.
- Right-click, choose “Format cells…”
- Select “Percentage” from the list of number formats.
- Choose the number of decimal places you need.
💡 Note: Excel automatically multiplies the value by 100 when you change to percentage format.
2. Calculating Percentages Manually

If you need to manually add percentages in Excel, follow these steps:
Step 1: Enter Your Data

Begin by inputting the data for which you want to calculate the percentage. For example, if you have sales figures for different regions:
- In cell A1, type “Region.”
- In cell B1, type “Sales.”
- Fill in the data for each region and their corresponding sales.
Step 2: Calculate Total Sales

Use the SUM function to calculate the total sales. Let’s assume your data is in cells B2 through B10:
=SUM(B2:B10)
Step 3: Compute Percentage

To find the percentage of sales each region contributes, use this formula in an empty column (let’s say column C):
=B2/B11
Here, B11 refers to the total sales calculated earlier.
💡 Note: Use the $ signs to fix the cell reference when dragging the formula down.
3. Using Excel Functions for Percentage Calculations

Excel offers a range of functions that can simplify percentage calculations. Here are two commonly used ones:
Calculating Increase/Decrease Percentage

Suppose you’re comparing sales from two different periods, here’s how you can calculate the percentage change:
- New value in one cell (let’s say B2).
- Old value in another (let’s say A2).
- In C2, enter the formula: =(B2-A2)/A2
Format this cell as a percentage to see the change in percentage terms.
Calculating Part-Whole Relationships

If you’re looking to find what percentage a part represents of a whole:
- Part in cell A1.
- Whole in cell B1.
- In C1, enter: =A1/B1
💡 Note: Ensure to format the result cell as a percentage to get the correct representation.
4. Creating Percentage Bars and Charts

Visual representation can make your data more insightful. Here’s how to create percentage charts:
Step 1: Set Up Your Data

Ensure your data is in a tabular format with columns for categories (like regions) and their corresponding percentages.
Step 2: Insert a Bar Chart

Highlight your data, go to the “Insert” tab, and select the appropriate chart type (e.g., a stacked bar chart).
Step 3: Customize the Chart

Change the chart title, axis titles, and customize the colors to make your chart more readable. Here are a few tips:
- Right-click on the chart to format its elements.
- Set the horizontal axis (Category) for your regions.
- Adjust the vertical axis (Value) to represent percentages.
💡 Note: For a more precise representation, you might want to include data labels to show exact percentages.
5. Automating Percentage Calculations with VBA

If you’re dealing with large datasets or want to automate repetitive percentage calculations, consider using VBA:
Step 1: Open the VBA Editor

Press Alt + F11 to open the Visual Basic for Applications (VBA) editor.
Step 2: Write Your Macro
Here’s a simple example of a macro that calculates the percentage for each value in column B relative to the total:
Sub CalculatePercentages()
    Dim ws As Worksheet
    Set ws = ActiveSheet
    Dim rng As Range
    Dim cell As Range
    Dim Total As Double

' Calculate total of sales in column B
Total = Application.WorksheetFunction.Sum(ws.Range("B:B"))

' Loop through each cell in column B and calculate percentage
For Each cell In ws.Range("B2:B" & ws.Cells(ws.Rows.Count, "B").End(xlUp).Row)
    cell.Offset(0, 1).Value = cell.Value / Total
Next cell

' Format the new column as percentage
ws.Range("C2:C" & ws.Cells(ws.Rows.Count, "B").End(xlUp).Row).NumberFormat = "0.00%"


End Sub
💡 Note: This macro assumes your data starts in row 2. Adjust the range as per your data.
This comprehensive guide takes you through the fundamental steps of adding and working with percentages in Excel, from manual calculations to using built-in functions, visual representation, and automation with VBA. Understanding these techniques not only makes data analysis in Excel more efficient but also enhances the storytelling power of your data through clear and insightful percentage-based presentations.
In summary, we’ve explored the simplicity behind Excel’s percentage calculations, the efficiency of automated processes, and the power of visual data representation. Whether you’re dealing with finance, statistics, or any other field where percentages play a crucial role, these five steps will empower you to handle data like a pro.
What is the quickest way to convert a number to a percentage in Excel?
+The quickest way to convert a number to a percentage is to select the cell, press Ctrl+1 to open the Format Cells dialog, choose “Percentage” under the Number tab, and select the number of decimal places you need.
Can I use formulas to automatically calculate percentages?
+Yes, you can use Excel functions like SUM or COUNTIF along with basic arithmetic formulas to automate percentage calculations.
How do I ensure my percentage values are accurate?
+Verify that your Excel settings are correct for the number format. Check the data you input, ensure your formulas are correct, and consider rounding for presentation if necessary.
Can I use VBA to speed up repetitive percentage calculations?
+Absolutely. VBA can be used to create custom macros that automate percentage calculations for large datasets, significantly reducing manual effort.
What should I do if my percentage chart doesn’t display properly?
+Ensure your chart data is correctly formatted as percentages, check if you’ve selected the right chart type, and make sure the axis settings are appropriate for your data range.


