Mastering Balance Sheets: Excel Spreadsheets Made Simple

Financial management is the lifeblood of any enterprise, and at the heart of financial management lies one key instrument: the balance sheet. For many, this can seem like a daunting document filled with jargon and intricate calculations, but fear not—Excel spreadsheets have the power to simplify it all. This blog post will guide you through the creation and interpretation of balance sheets using Excel, making the process not only straightforward but also quite illuminating.
Understanding the Balance Sheet

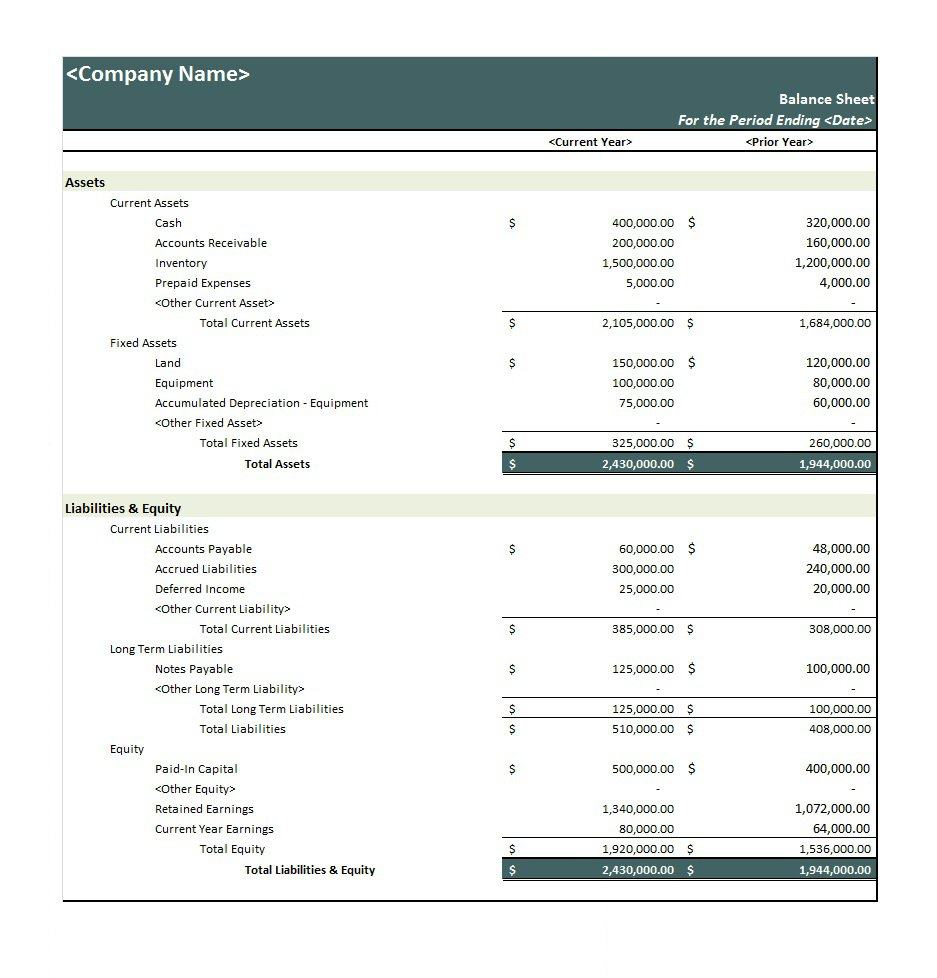
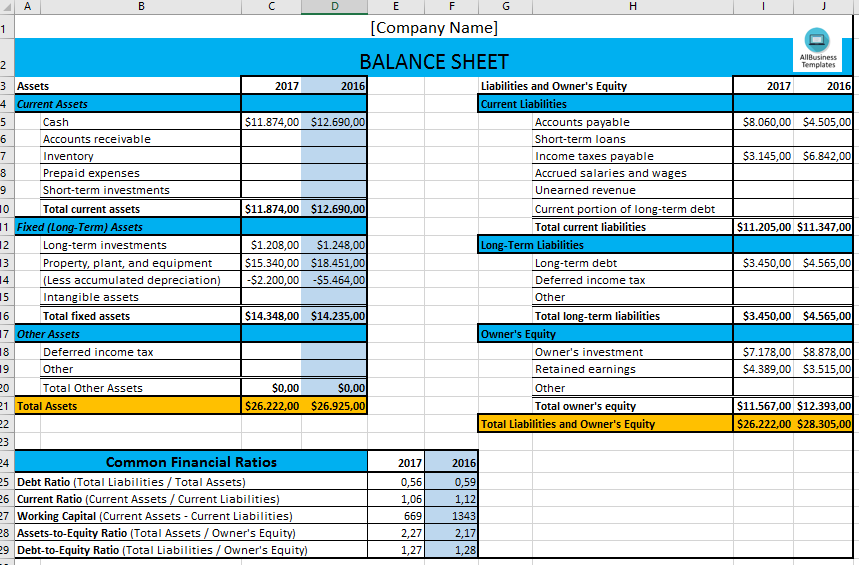
A balance sheet provides a snapshot of a company’s financial condition at a specific moment in time. Here are its core components:
- Assets: Everything the company owns that has value.
- Liabilities: All the debts and obligations the company has.
- Equity: The owner’s claim after subtracting liabilities from assets, often called shareholders’ equity or net worth.
The foundational principle is that the balance sheet must balance: Assets = Liabilities + Equity. This equation, known as the accounting equation, is the cornerstone of any balance sheet.
Why Use Excel for Balance Sheets?

Excel spreadsheets are not just about adding numbers; they:
- Automate calculations, ensuring accuracy and consistency.
- Offer tools for easy visualization like charts and conditional formatting.
- Allow for scalable templates that can be adapted as the business grows.
- Provide real-time data analysis with features like pivot tables.
Creating Your First Balance Sheet in Excel

Follow these steps to craft a simple balance sheet:
- Set Up Your Worksheet: Open Excel and give your sheet a clear name, like “Balance Sheet Q1 2023”.
- Label Your Columns: Create headers for ‘Assets’, ‘Liabilities’, and ‘Equity’.
- Input Data: Start with your assets, listing each type of asset separately under the ‘Assets’ column. Follow the same process for liabilities and equity.
- Formula Magic: Use Excel formulas like
=SUM()to automatically calculate totals and verify the balance sheet’s accuracy.
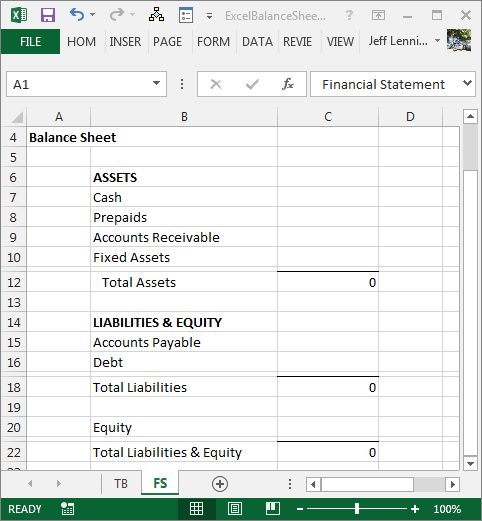
Here is a basic example of how you might structure the data:
| Assets | Amount ($) |
|---|---|
| Current Assets | 50,000 |
| Fixed Assets | 150,000 |
| Total Assets | =SUM(B2:B3) |

🚫 Note: Remember to input your actual data and ensure all numbers are consistent across categories.
Advanced Features for Dynamic Analysis

Excel doesn’t stop at basic arithmetic; it empowers you with features for dynamic financial analysis:
- Conditional Formatting: Highlight negative numbers in red to quickly identify areas of concern.
- Sparklines: Add mini-charts within cells to display trends over time.
- Pivot Tables: Summarize, analyze, and explore your data from different perspectives.
- What-If Analysis: Use tools like Scenario Manager or Data Tables to see how changes in assumptions affect your balance sheet.
🛠️ Note: These advanced tools can be intimidating at first, but Excel's vast resources and help guides can be your allies in mastering these functions.
Troubleshooting and Common Pitfalls

Even with the simplicity Excel brings, users can encounter issues:
- Formula Errors: A misstep in cell references can skew your balance sheet. Double-check your formulas and use the trace precedent/dependent features to ensure everything links correctly.
- Data Entry Mistakes: Typographical errors or incorrect categorization can distort the accuracy of your financial statement. Consider using data validation rules to minimize this risk.
- Formatting Nightmares: Formatting can affect how data is perceived. Use consistent formatting and consider using tables for a cleaner presentation.
The Future of Balance Sheets

As businesses grow and adapt, so do their financial reporting needs:
- Integration with other financial tools for seamless data flow.
- Adoption of cloud-based Excel solutions for collaborative work and real-time updates.
- Use of AI and machine learning to predict trends and alert for anomalies.
The summary in the end of this post, crafting a balance sheet in Excel is not just about organizing numbers; it's about painting a clear picture of your financial health. By leveraging Excel's capabilities, you streamline the process, enhance accuracy, and unlock powerful analytical tools for better decision-making. Whether you're a small business owner or a finance professional, mastering Excel for balance sheets can significantly ease your financial management duties.
What makes Excel suitable for balance sheet creation?

+
Excel’s ability to automate calculations, provide data validation, offer visual tools like charts, and allow for scalable templates makes it a robust platform for creating and managing balance sheets.
Can Excel handle complex balance sheets?

+
Absolutely! Excel provides advanced features like Pivot Tables, conditional formatting, and what-if analysis, enabling you to create and manage even the most complex balance sheets efficiently.
How can I ensure my balance sheet balances?

+
Ensure your data input is accurate, use Excel formulas correctly, and double-check that your total assets equal the sum of your total liabilities and equity. You can also add a verification formula to highlight discrepancies.
What are some common mistakes when creating balance sheets in Excel?

+
Common mistakes include incorrect formula usage, data entry errors, and formatting issues that can obscure data clarity. Regularly review your work and consider using data validation to prevent many of these mistakes.


